 3 hours ago
4
3 hours ago
4 
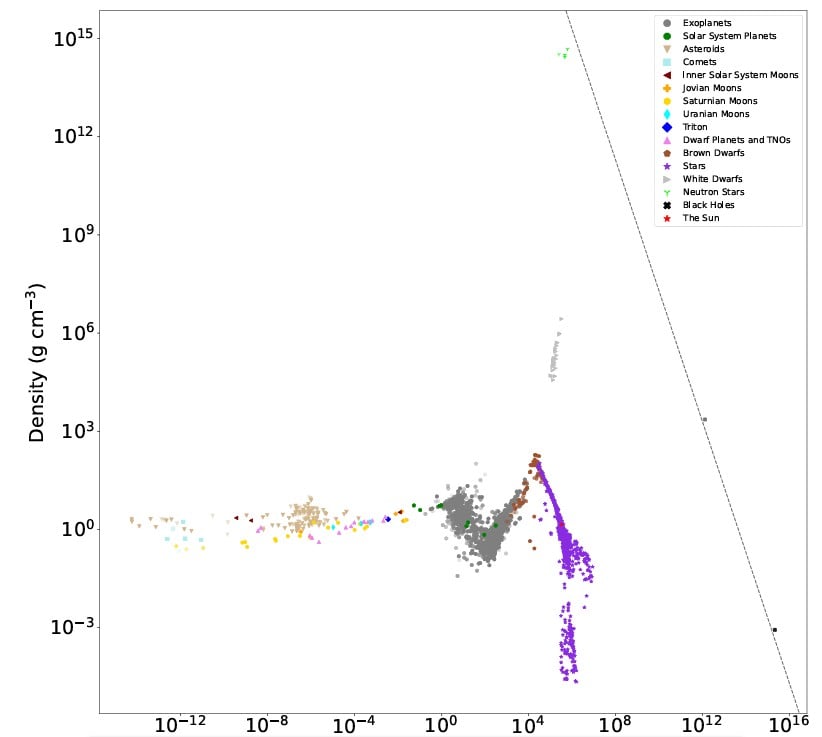
If you’ve ever taken an introductory astronomy class, you’ve probably seen the Hertzsprung-Russell (HR) diagram. This graph maps out the life cycle of stars by plotting their temperature against their luminosity, and has been a “cheat sheet” for stellar astrophysics for over a century. But the universe is full of more than just stars, and a new paper, available in pre-print on arXiv from Gabriel Steward and Matthew Hedman of the University of Idaho, attempts to do for the density and mass of all objects what the HR diagram did for the lifecycle of stars - provide a coherent, visual map to represent them.


 Bengali (Bangladesh) ·
  English (United States) ·