

NEAR Protocol fell below the $3 mark overnight into Sunday, November 15, 2026. According to CoinGecko, NEAR traded at $3.13 at 4:50 a.m. CET, equivalent to €2.84, down 6.9 percent from 24 hours earlier. The overnight low was $2.88. Measured against the autumn high of October 11, the coin has lost almost half of its value. As far as was known by then, there was no NEAR-specific trigger: the coin fell with the entire crypto market, but more than twice as hard as bitcoin. Anyone following the NEAR Protocol price prediction now sees the price back at its mid-September level, where the big autumn rally began.
This article puts the day's numbers into context, shows the price levels below $3 and explains what open interest, the long/short ratio and leverage are currently saying about NEAR. The live price is on the NEAR price page.
NEAR crash on November 14: price, daily range and volume
According to CoinGecko, the 24-hour high was $3.40 and the low $2.88, a gap of just over 15 percent. On the Kraken exchange, NEAR closed Saturday at $3.031, after $3.438 on Friday. That is a daily loss of 11.8 percent. NEAR hit its daily low on Kraken late in the evening, between 10 and 11 p.m. CET, at $2.859. The same hour saw bitcoin break below $64,000.
Market capitalisation, the price multiplied by the number of coins in circulation, sank to around $4.1 billion. That puts NEAR at number 23 in the CoinGecko ranking. Over seven days the loss is 14.7 percent, over 30 days 40.5 percent. Volume, on the other hand, rose. On Kraken, around 4.83 million NEAR changed hands against the US dollar on November 14, compared with an average of just over 3.0 million NEAR a day over the previous seven days. Saturday therefore brought 1.6 times the volume of an ordinary day, even though weekends usually see less trading. Rising volume on falling prices means that real selling took place.
When was NEAR last this low?
The November 14 close is the lowest since September 16, 2026. On that day NEAR closed at $2.618 on Kraken, and a day later already at $3.143. Over the following three and a half weeks came one of the strongest rallies among the major coins this year: from the September 15 close of $2.333, NEAR climbed to $5.890 by October 11, a gain of 152 percent. From that high the price has now fallen 48.5 percent.
NEAR's all-time high, according to CoinGecko, is $20.44 from January 16, 2022, almost 85 percent above today's price. For current investors another comparison is more telling. Exactly one year ago, on November 15, 2025, NEAR closed at $2.405. Despite the crash, the coin is still trading a good quarter higher than twelve months ago. The low for the year on a closing basis was $0.961 on February 11, 2026. Anyone who bought only in October, by contrast, has lost up to half of their stake.
Why is NEAR falling? Rate fears, ETF outflows and fewer stablecoins
The decline in NEAR is part of a broad sell-off. In the 24 hours to 4:50 a.m., bitcoin lost 3.0 percent according to CoinGecko and traded at around $64,900, while ether fell 3.7 percent to around $1,820. A crypto crash typically hits smaller coins such as NEAR harder, because their markets are thinner and investors cut their riskiest positions first in times of stress. Our background piece gives a detailed answer to the question why is bitcoin falling.
The trade press agrees on three burdens. The first is the rate outlook. According to CME FedWatch, the futures market on November 14 priced an 88.5 percent probability that the US Federal Reserve will raise its key rate by a quarter point at its meeting on December 8 and 9, as Bitcoin.com reports. Higher rates make credit more expensive and speculative assets less attractive.
The second burden is fund outflows. According to data from Farside Investors, investors pulled around $1.07 billion from US spot bitcoin ETFs between November 9 and 13, and $398.9 million from the ether funds, Coinpaper reports. The third is liquidity in the crypto market. The same outlet cites the weekly report from Coinbase Institutional, according to which the combined supply of the stablecoins USDT, USDC and DAI shrank by $11.5 billion within 30 days. Stablecoins are dollar-pegged tokens that investors use to buy on crypto exchanges. When their supply shrinks, buying power is missing.
Sentiment is reflected in the Fear and Greed Index from alternative.me, a mood gauge running from 0 for extreme fear to 100 for extreme greed. It stood at 10 points on November 15, after 13 the day before. We summarise the reasons behind the day's moves under why is crypto down.
NEAR itself was already under pressure before the weekend. On November 14, cryptoticker.io reported that 11.8 million NEAR stolen in the Binance hack are still sitting on the attackers' addresses; our article NEAR Protocol and the Binance hack explains the background. According to that report, those coins had not been moved. Whether the possible selling pressure amplified Saturday's decline cannot be read from the price data. The timing fits the overall market better: the steepest part of the slide came in the evening, when bitcoin also slumped.
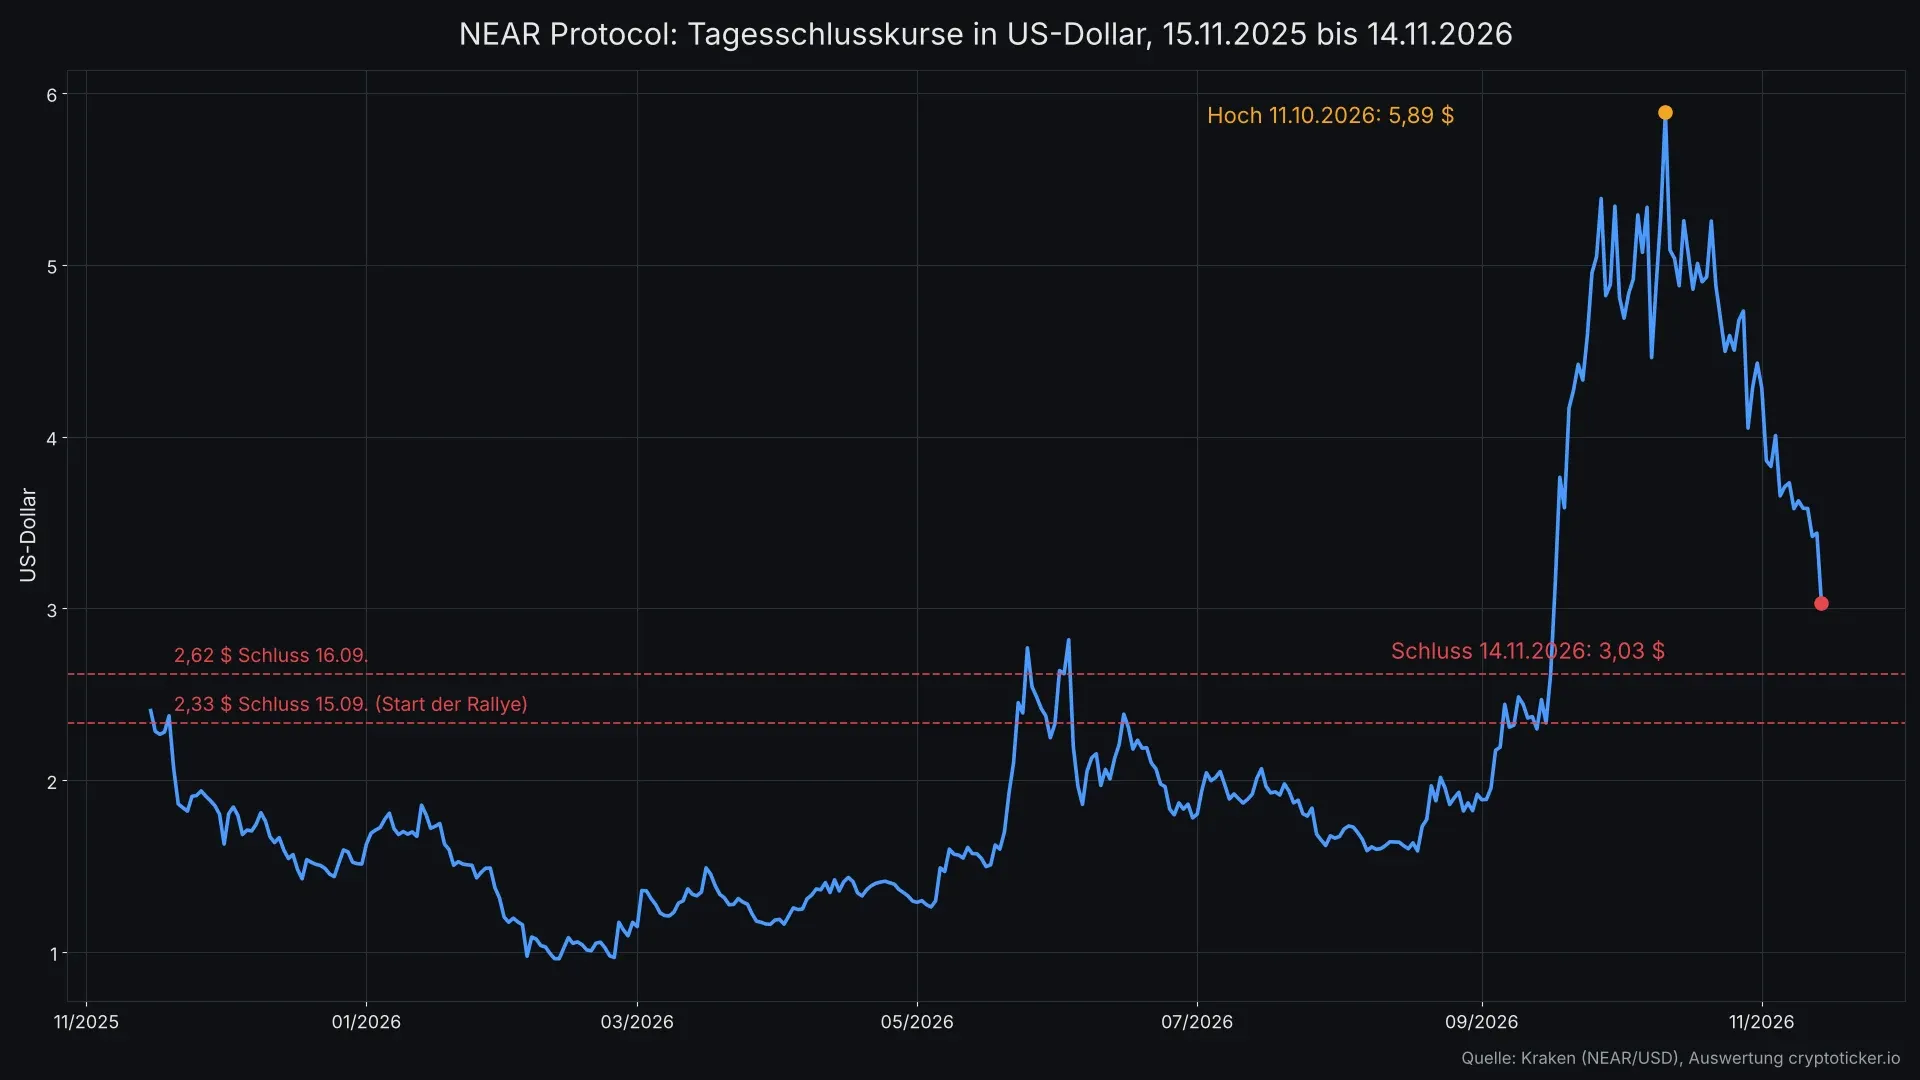 NEAR daily closes on Kraken over twelve months: half of the autumn rally has been given back.
NEAR after the autumn rally: up 152 percent, down 48 percent
The chart shows NEAR's daily closing prices on Kraken over the past twelve months. For a long time the coin oscillated between $1 and just under $3. Only in mid-September did the steep climb begin that carried the price above $5 within a few weeks. Since the October 11 high, the curve shows a sequence of lower highs and lower lows. In November alone, the close fell from $4.28 on November 1 via $3.58 on November 11 to $3.03 on Saturday.
This history explains why NEAR is falling harder than bitcoin. A large share of holders bought in the weeks after the high and are now well under water. With every new bout of weakness, some of them sell to limit their losses. In crypto downturns, steep gains made in a short time are often largely given back, because there are hardly any price zones in between where trading took place for long.
NEAR among the top 25: who lost most in 24 hours
Among the 25 largest cryptocurrencies by market capitalisation, only Cardano, down 7.9 percent, and Litecoin, down 7.5 percent, lost more than NEAR at 4:48 a.m., according to CoinGecko. Monero followed with 6.7 percent and Dogecoin with 6.0 percent. Bitcoin held up more than twice as well with a 2.8 percent loss, and TRON lost only 1.3 percent. Our piece on the Cardano crash covers the Cardano slide of the same night, and the piece on the Chainlink crash covers the decline in Chainlink.
NEAR open interest: positions stay open
Open interest is the value of all outstanding futures contracts on a coin. When it rises, new bets are being added; when it falls, positions are being closed, voluntarily or through liquidation. A liquidation is the forced closure of a leveraged position by the exchange as soon as the posted capital no longer covers the losses.
Public market data from the OKX exchange paint a striking picture for the NEAR perpetual contract. Between 4 a.m. on November 14 and 4 a.m. on November 15 CET, open interest in dollar terms fell from $44.1 million to $41.2 million, a drop of 6.6 percent. Measured in NEAR, however, it stayed almost flat, slipping from 13.20 million to 13.12 million NEAR, a mere 0.6 percent. The fall in dollar terms is therefore almost entirely a price effect. Unlike many large coins that evening, NEAR saw no significant wave of forced closures on OKX. The bets remain open.
Other figures show how violent the evening was across the market. According to Bitcoin.com, bitcoin's fall on November 14 led to liquidations of around $1 billion across the whole crypto market in 24 hours. Later that evening bitcoin dropped below $64,000. According to TokenPost, positions worth $691 million were liquidated within an hour, $671 million of them longs and only $19.5 million shorts. None of these sources breaks out how much of that fell on NEAR.
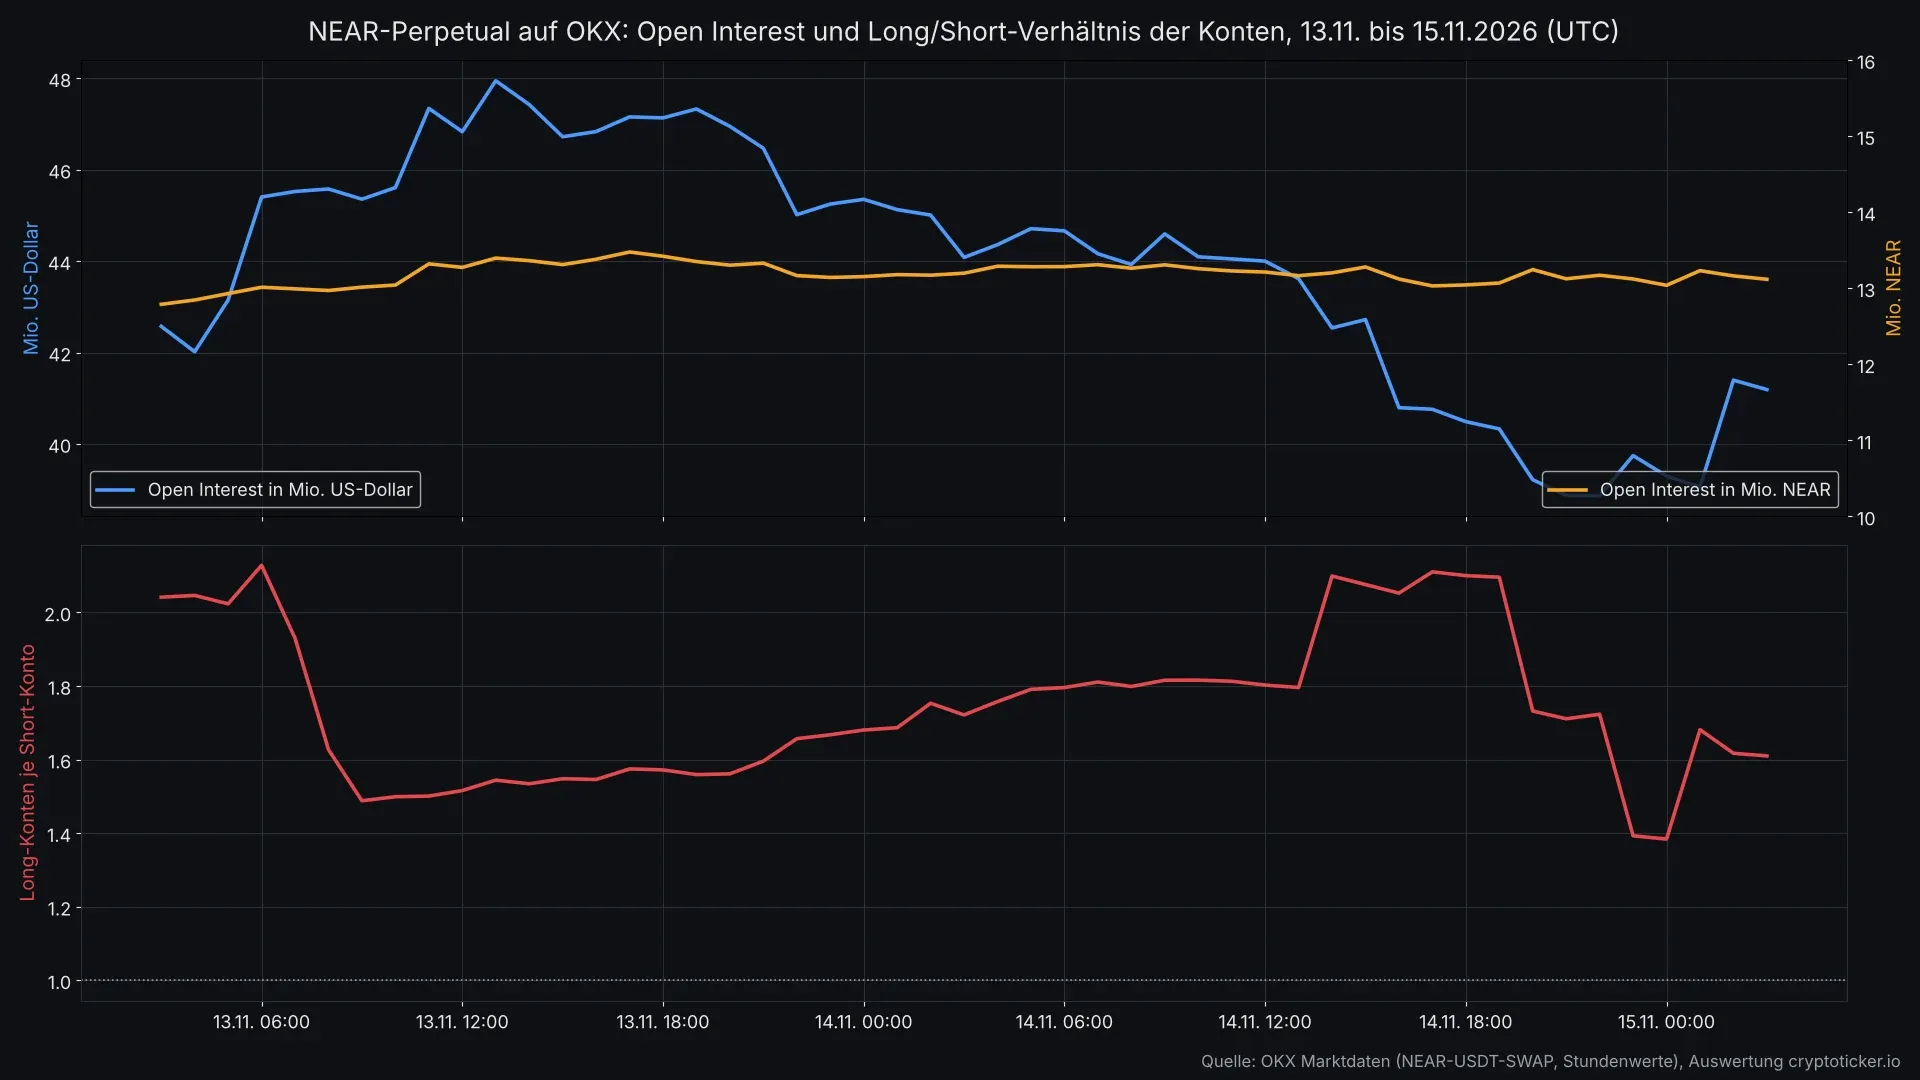 The dollar value of open NEAR contracts falls, while the number of contracts in NEAR stays almost the same.
NEAR long/short ratio: the majority stays long
The account long/short ratio states how many accounts are betting on rising prices for every account betting on falling prices. On OKX it stood at 1.72 for NEAR at 4 a.m. on November 14. As the price fell in the afternoon, it rose to 2.11 by 6 p.m. Many traders therefore used the decline to open new long positions. After the slump late in the evening it dropped to 1.38 by 1 a.m. and was back at 1.61 at 4 a.m.
That means just over 60 percent of accounts are still betting on a rising NEAR price. The contract's funding rate, the fee that flows between the long and short sides, was slightly positive at 0.005 percent per eight-hour period, so longs are paying. If the price keeps falling, a large number of open long positions are at risk, and their forced closure would accelerate the decline. cryptoticker.io compiled this analysis itself on November 15, 2026, based on hourly OKX data over 48 hours and Kraken daily closes over twelve months.
NEAR leverage: how long, short and the liquidation price work
Leverage multiplies the effect of every price move on the capital deployed, in both directions. At 10x leverage, a 10 percent price change moves the position by 100 percent. If NEAR rises from $3.13 to $3.44, a 10x long doubles its capital. If NEAR falls from $3.13 to $2.82, the capital is wiped out. In practice the exchange closes the position slightly earlier, because it keeps a safety margin for fees and slippage.
At 100x, around 1 percent is enough. A long opened at $3.13 would be gone at about $3.10, less than the move of an ordinary trading hour this weekend. Between the 24-hour high of $3.40 and the low of $2.88 lay just over 15 percent. A long opened at the high with leverage of about 6.5x or more would, on paper, not have survived the drop to the low.
A short position works the other way round: it gains when the price falls and is liquidated when it rises. The night itself showed how fast that can happen. Between 3 and 4 a.m. CET, NEAR rose on Kraken from $2.95 to $3.14, a gain of around 6 percent within an hour. A 20x short would have been wiped out.
Stop-loss and position size in NEAR trades
A stop-loss is an order that closes a position automatically once a set price is reached. It caps the loss before liquidation kicks in. Leveraged traders also size their positions so that a loss down to the stop-loss costs only a small part of the account, with 1 to 2 percent often cited. In fast markets, however, a stop-loss can be filled below the intended price, because there are no buyers between two prices. That applies especially to nights like Saturday's, when the price jumps several percent within an hour.
Will NEAR fall below $2.62? The levels from the price history
Kraken's daily closes yield three levels to the downside. The first is the overnight low at $2.859. The second is the September 16 close at $2.618, the last daily close below today's level. The third is the starting point of the autumn rally: on September 15, NEAR closed at $2.333. Below that, the entire climb since mid-September would have been fully given back. NEAR last set an interim high in this range at $2.818 on June 3, before the price fell back over the summer to around $1.59.
To the upside, Friday's close at $3.438 stands in the way first, and above it the November 11 close at $3.58. Whether any of these levels will hold cannot be predicted. They do show, however, where trading took place in the autumn and where the price last found support.
For context, it helps to look at bitcoin, which sets the pace of the market. Our analysis how low can bitcoin fall shows how far the largest coin dropped in earlier cycles. The article on the 200-week line explains why the bitcoin price is currently trading below a long-term moving average, and the bitcoin price prediction 2027 collects what analysts expect for next year.
Trading NEAR in Europe: MiCA exchanges, futures and CFDs
If you want to buy or sell NEAR, or bet on a move, you have three routes. The simplest is buying through a crypto exchange or broker licensed under the EU's crypto regulation MiCA. MiCA stands for Markets in Crypto-Assets and, since the end of 2024, has governed across the EU which providers may trade and hold crypto assets for clients. Kraken and OKX, for example, list NEAR. Our comparison of the best crypto exchanges shows which platform charges which fees.
The second route is futures and perpetuals, futures contracts with no expiry date that let you trade long and short with leverage. They are offered by centralised exchanges and by decentralised venues, which our comparison of perp DEXs lists. The third route is CFDs, contracts for difference on the price, such as those that CFD brokers like XTB offer on cryptocurrencies. A CFD only tracks the price movement, and you do not own any coins.
CFDs are complex instruments and come with a high risk of losing money rapidly due to leverage. A high percentage of retail investor accounts lose money when trading CFDs. You should consider whether you understand how CFDs work and whether you can afford to take the high risk of losing your money.
Sell or hold NEAR? Two scenarios after the crash
This article cannot and does not want to give a recommendation. It does help, though, to frame the situation in conditions that can be checked.
In the first scenario, the overall market calms down. Bitcoin stabilises, the liquidation wave runs its course and NEAR holds the $2.62 level on a daily closing basis. Part of the autumn rally would then remain intact, and a recovery towards $3.44, where the price still closed on Friday, would be possible. The long/short ratio shows that many traders are betting on exactly that.
In the second scenario, the sell-off continues, driven by further ETF outflows or a sharper rate outlook ahead of the Fed meeting in December. A NEAR close below $2.62 would be the lowest daily close since mid-September, and the rally's starting point at $2.33 would come within reach. The many open long positions would accelerate such a break through forced selling. Our article buy or sell bitcoin describes how investors in the bitcoin market deal with the same question. The piece on the bitcoin bear market shows what earlier downturns reveal, and the article on the question when will bitcoin go back up describes the conditions under which analysts expect a recovery.
Whatever the scenario, anyone holding NEAR with leverage should check their own liquidation price against the levels above. Those holding without leverage lose money if prices keep falling, but are not forced out of the position.
Weekend crypto crash: bitcoin, altcoins and equities
NEAR is not alone on this day. Our crypto news on the bitcoin slump give an overview of the whole day, and we update the running state of the crypto crash today there continuously. Our overview of the stock market crash shows how the decline fits into the situation on the other financial markets. The article on Strategy stock looks at how companies with large bitcoin holdings are coming through the slump. Whether the planned IPO of AI company Anthropic is drawing capital away from the crypto market is an open question among investors; what is known about the offering is on our page on Anthropic stock. Our explainer NEAR Protocol explained covers what makes NEAR Protocol tick technically.
NEAR price: below $2.62 lies the start of the autumn rally
Note the levels. The September 16 close of $2.62 decides the next move, and below it lies the rally's starting point at $2.33. Providers that list NEAR are in our comparison of crypto exchanges. Recalculate your leverage. Leveraged traders recalculate their own liquidation price and set a stop-loss. Our comparison of crypto brokers lists platforms for futures and CFDs. Choose a trading venue. For buying and selling without leverage, MiCA-licensed providers are a good fit. The overview of MiCA-regulated exchanges shows which ones they are.(As of November 15, 2026. This article is not investment advice. Prices and fee structures change; check the terms with the provider before you buy.)





 Bengali (Bangladesh) ·
 English (United States) ·