

PEPE trades at around $0.00000316 on August 20, 2026, well below its twelve-month high of $0.00001193 from September 14, 2025. The coin has gained almost 18 percent over the past 24 hours, yet it still carries a twelve-month loss of around 75 percent. Moments like this raise the question readers click on at cryptoticker.io every day: is PEPE a good buy at the current price, or are you catching a falling knife?
cryptoticker.io compiled the price data in this article on August 20, 2026. The source is market data from CoinMarketCap, processed from daily closing prices over the past 365 days. The moving averages and the RSI(14) are calculated from those daily closes using the standard formulas.
PEPE Price Analysis: Where the Price Stands and Which Levels Matter Now
The current PEPE price of $0.00000316 sits precisely between two chart anchors. On the downside, the twelve-month low of $0.00000232 from July 2, 2026 provides support, currently around 27 percent below the price. On the upside, the 200-day moving average at $0.00000325 is pulling higher, and the coin is now testing it seriously for the first time since early July. The zone between $0.0000031 and $0.0000033 is the decisive threshold for the coming weeks.
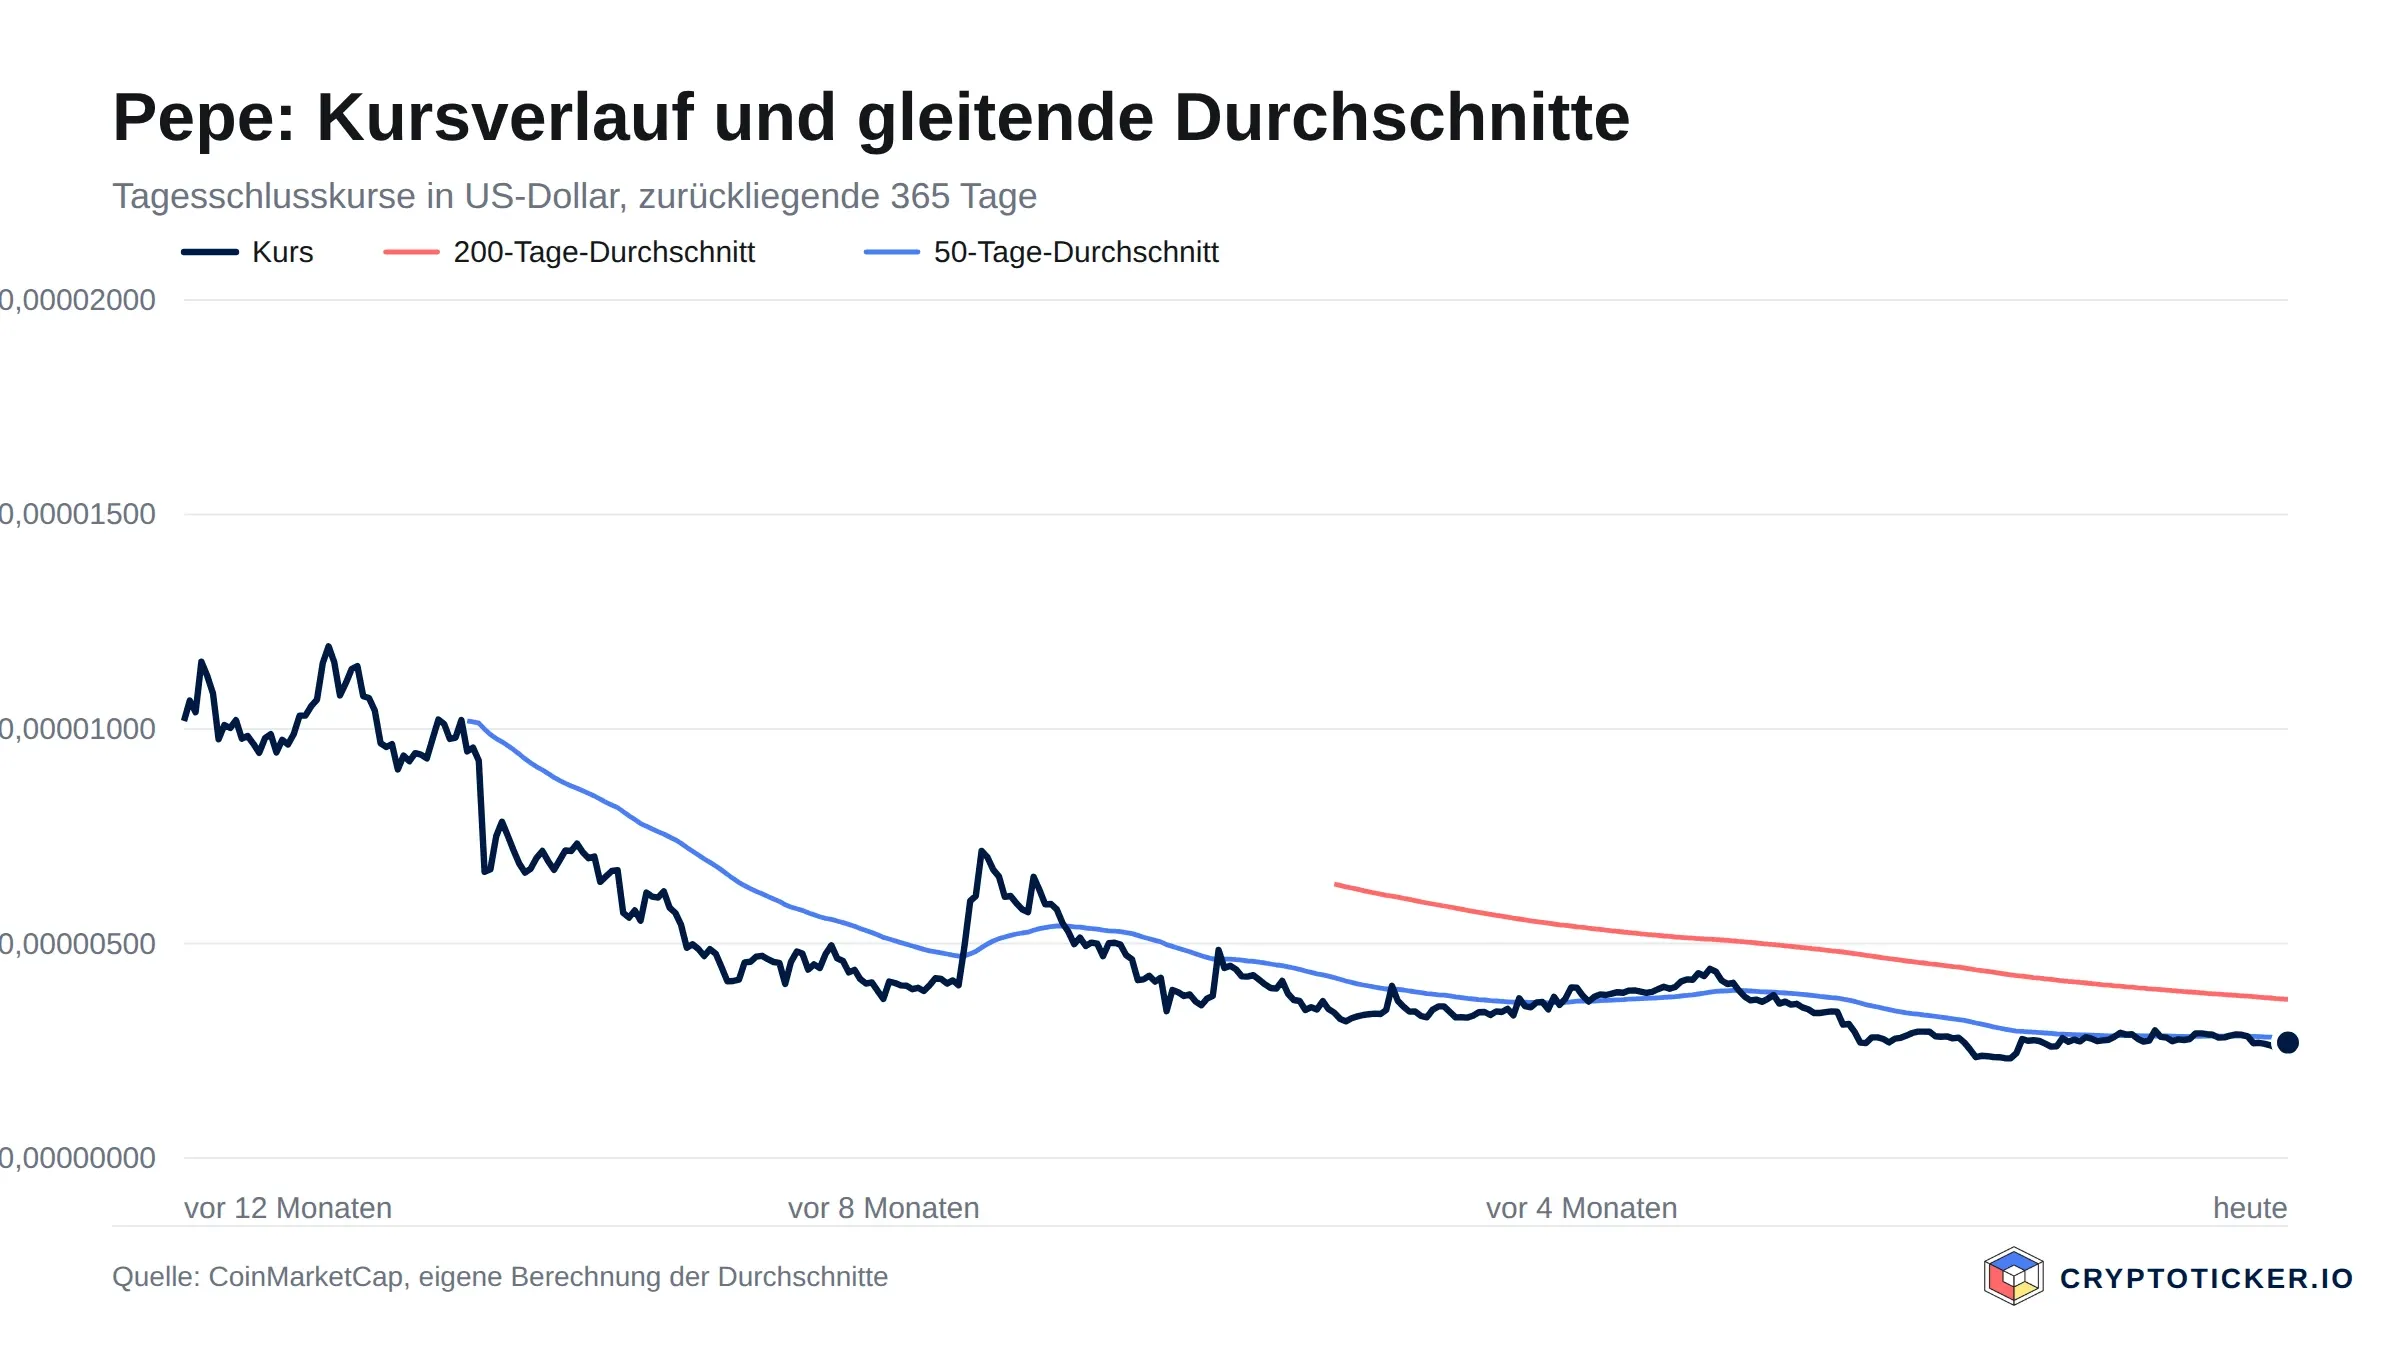 Pepe price and moving averages, own calculation from CoinMarketCap daily closing prices
The 50-day moving average at $0.00000269 has already been reclaimed. As long as PEPE holds above that level, the rebound off the July low remains technically intact. Should the coin lose $0.00000269 again, $0.00000232 moves back into focus. A break below that turns the base-building into a fresh leg down, and the price can then drop quickly to the $0.000002 mark.
Is the PEPE Downtrend Broken or Merely Interrupted
Over twelve months the downtrend clearly dominates. At around 75 percent below the high of $0.00001193, the trend has been red for a year. The 200-day moving average at $0.00000325 is still falling. A broken downtrend looks different: it requires a daily close clearly above the 200-day mark plus a subsequent consolidation above that line.
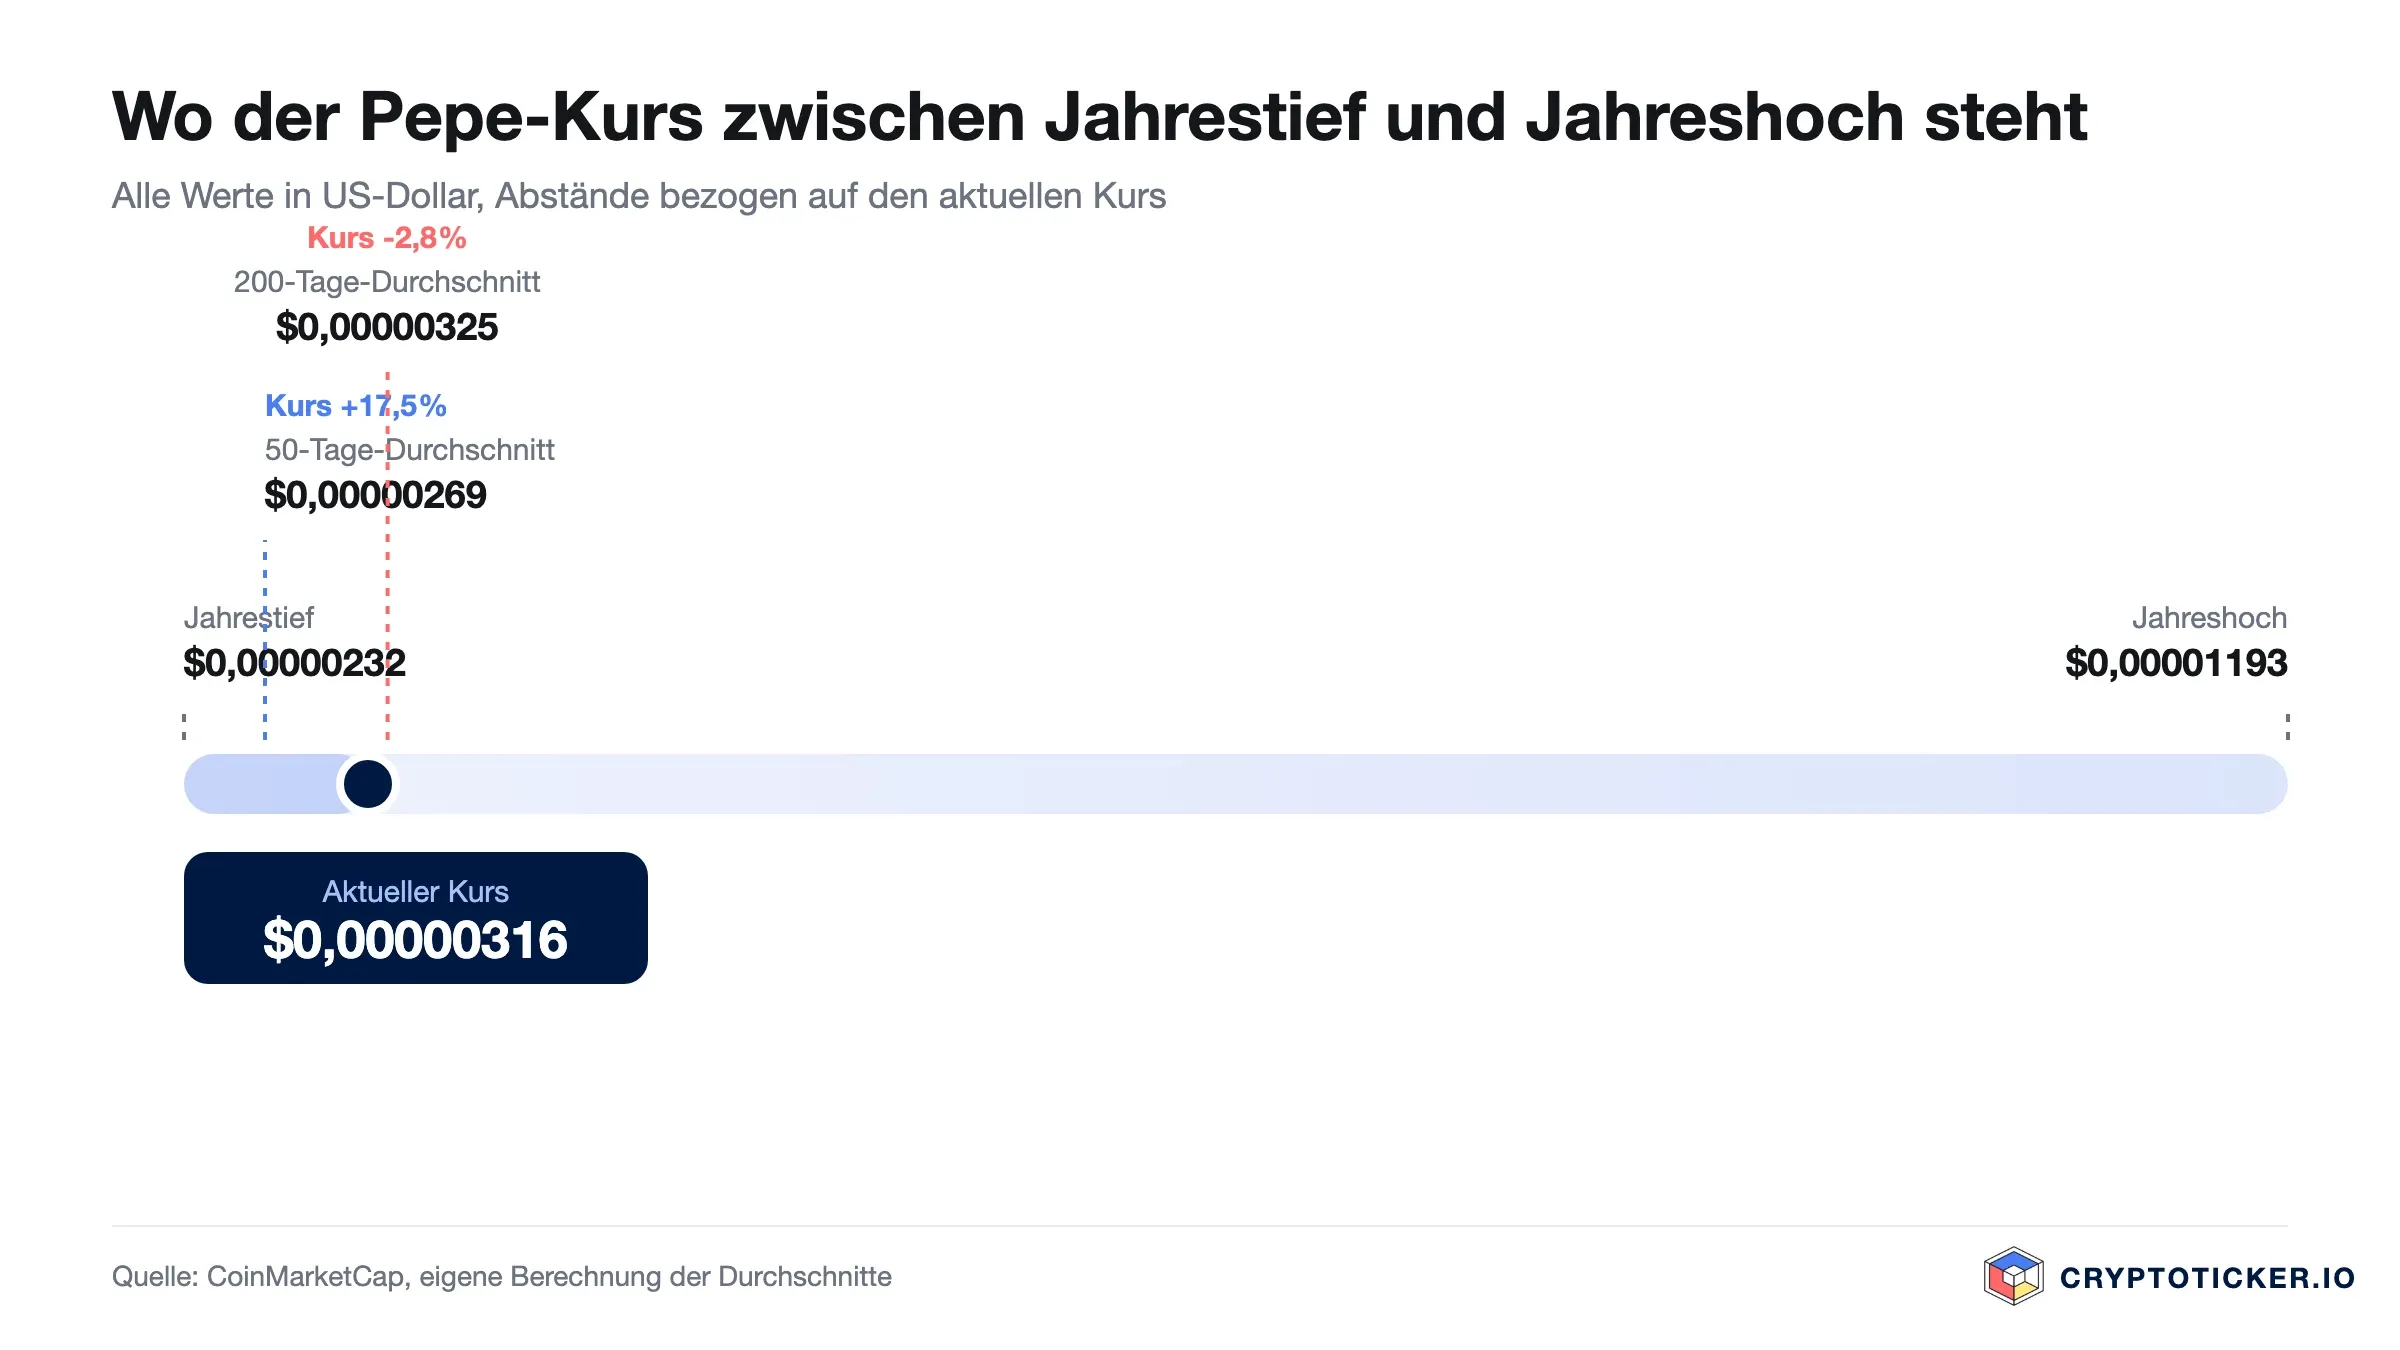 The Pepe price relative to the twelve-month low, the twelve-month high and both moving averages
The short-term picture looks friendlier. The price tested the twelve-month low twice and held on the second attempt. The last three weekly candles are green in a row. That is the precursor to a base, though not yet its confirmation. The current signal is therefore contradictory: an intact long-term downtrend sitting above the zone that decides whether this rebound starts a reversal or stays an interim recovery within the ongoing bear trend.
What RSI and Moving Averages Mean for a PEPE Entry
The daily RSI(14) stands at 36.2. That is neutral to mildly oversold and nowhere near overheated. For comparison: in late September 2025, shortly before the slide from the twelve-month high, the RSI was above 70. The current reading says two things at once. The coin is NOT in extreme territory, and the rally of the past few days has not yet stretched the indicator. Anyone entering now is technically not buying into an exhausted move.
The 50-day average has not yet crossed above the 200-day average. The 50-day figure of $0.00000269 remains below the 200-day figure of $0.00000325. As long as that picture holds, the moving averages argue against a strategic entry with a long horizon. Traders with a short-term focus, by contrast, see a plannable opportunity in the current setup: entry at the 50-day line, target the 200-day line, stop below the July low.
What PEPE Trading Volume Reveals About Demand
The 24-hour volume on August 20, 2026 is around $1.4 billion. Measured against a market capitalisation of $1.31 billion, that is a volume-to-market-cap ratio of more than 100 percent. Such a reading is typical for PEPE, because the coin has a very active trader base and its turnover has historically been the highest among memecoins in the top 50. This liquidity is a core strength, since it lets larger addresses enter and exit without heavy slippage.
The distribution of volume over the past seven days stands out. The gain of around 17 percent came with rising daily turnover on a market that was anything but thin. That is qualitatively different from a recovery attempt on falling volume. Short-term demand is therefore present. It is not as large as during the peak phases of autumn 2025, but it is enough to carry current prices. A genuine reversal would require days with volume above $2 billion alongside daily gains beyond 10 percent.
Which Structural Factors Speak in Favour of PEPE as a Memecoin
PEPE is an ERC-20 token on Ethereum. That is the first structural point: the coin rests on the foundation of the second-largest blockchain, with full compatibility with every serious exchange and every EVM wallet. Ethereum's roadmap continues to work on lower fees for token transfers via layer-2 solutions, and every ERC-20 token benefits from that, PEPE included. Details on the next build-out stage are set out in the official Ethereum roadmap.
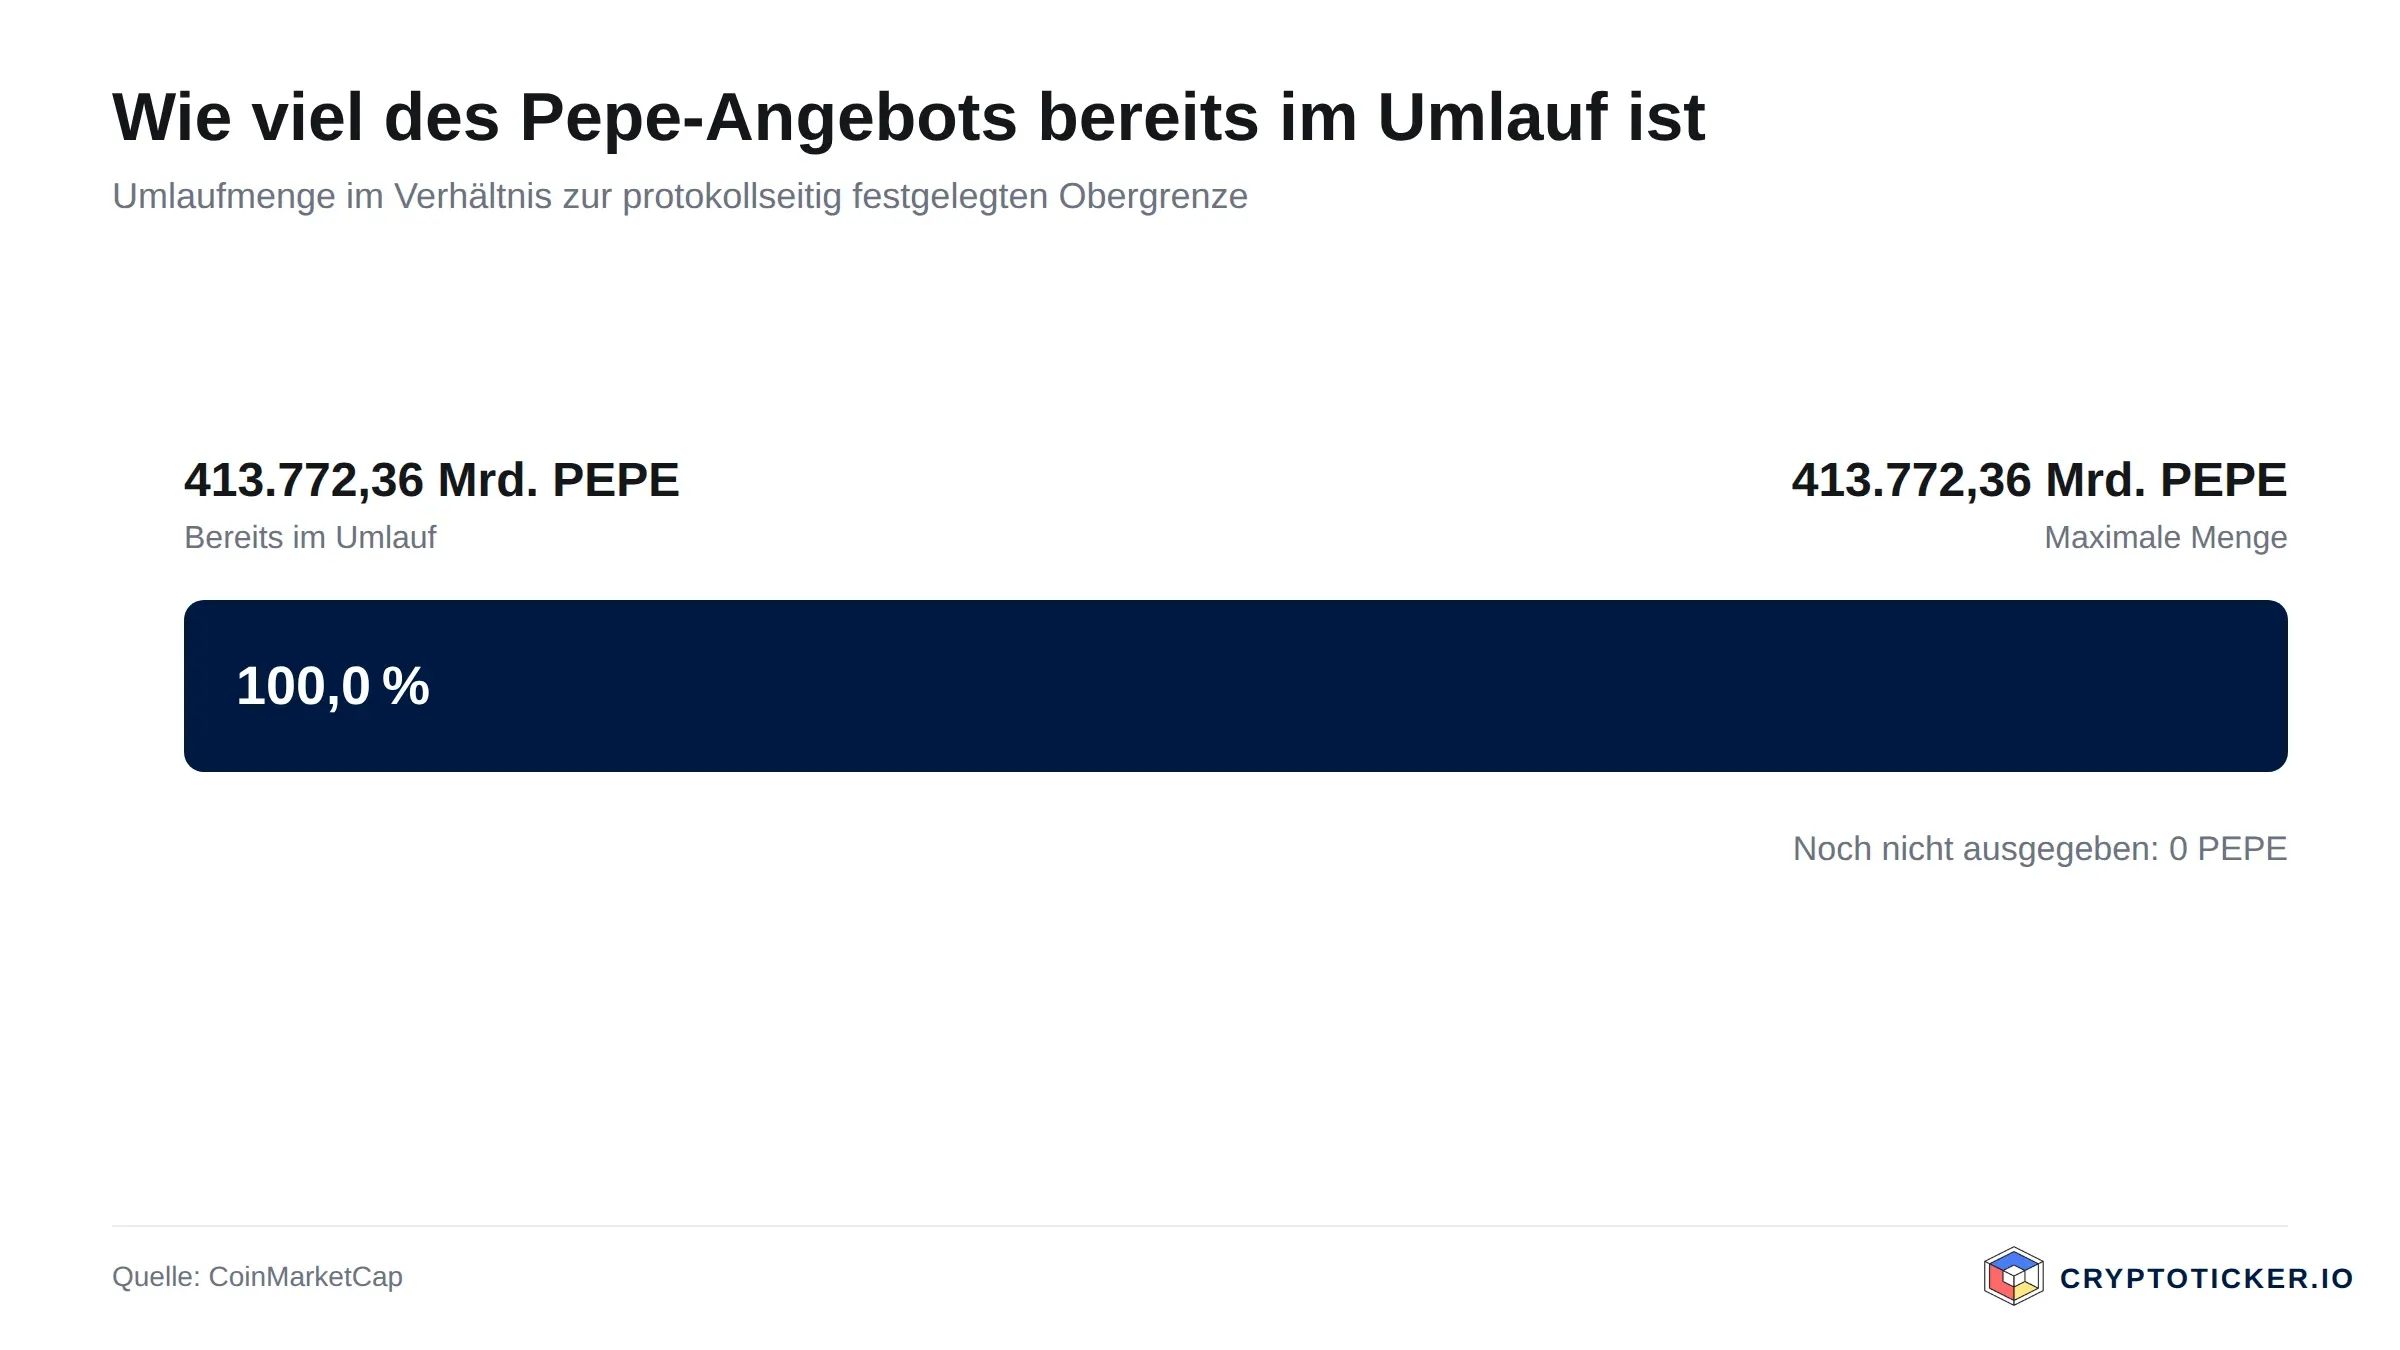 Pepe supply structure based on CoinMarketCap data
Supply is a second distinctive feature. The circulating amount is 413.77 trillion tokens, and that is at the same time the maximum supply. There is therefore NO inflation. Every price gain is driven purely by demand. With memecoins that carry no cap you cannot say the same. Rank 49 by market capitalisation is stable, and PEPE has been in the top 60 continuously since the end of 2023. For a memecoin that is an unusually long run.
The third point concerns regulation. As a pure memecoin with no utility promise, PEPE does not fall under the MiCA category of utility tokens with strict white paper obligations in Europe. Trading itself remains subject to securities supervision law, and the European supervisory authority ESMA tightened in 2025 what exchanges must disclose on highly speculative assets. Details on European crypto supervision are available on the ESMA website. For you as an investor that means exchanges with a MiCA licence must actively inform you about the loss risks before you buy.
What Speaks FOR Buying PEPE at the Current Price
First, the distance to the upside. From the current level of $0.00000316 to the twelve-month high of $0.00001193 there is almost 277 percent of price potential in purely arithmetical terms. Swings of that size are historically documented for PEPE and have occurred several times.
Second, market sentiment. The Fear and Greed Index stands at 62, which places it in greed territory. That may sound paradoxical, but greed regimes typically push investors into the riskier segments of the market, and memecoins are the riskiest segment category there is. The potential for capital inflows is therefore present.
Third, the hard supply cap of 413.77 trillion tokens. No new issuance, no dilution, no vesting unlocks that will weigh on the market later. What is in circulation today stays there.
What Speaks AGAINST Buying PEPE at the Current Price
First, the long-term trend. A twelve-month loss of 75 percent is a structure rather than a snapshot. Without reclaiming the 200-day line at $0.00000325, every recovery remains under suspicion of being an interim move.
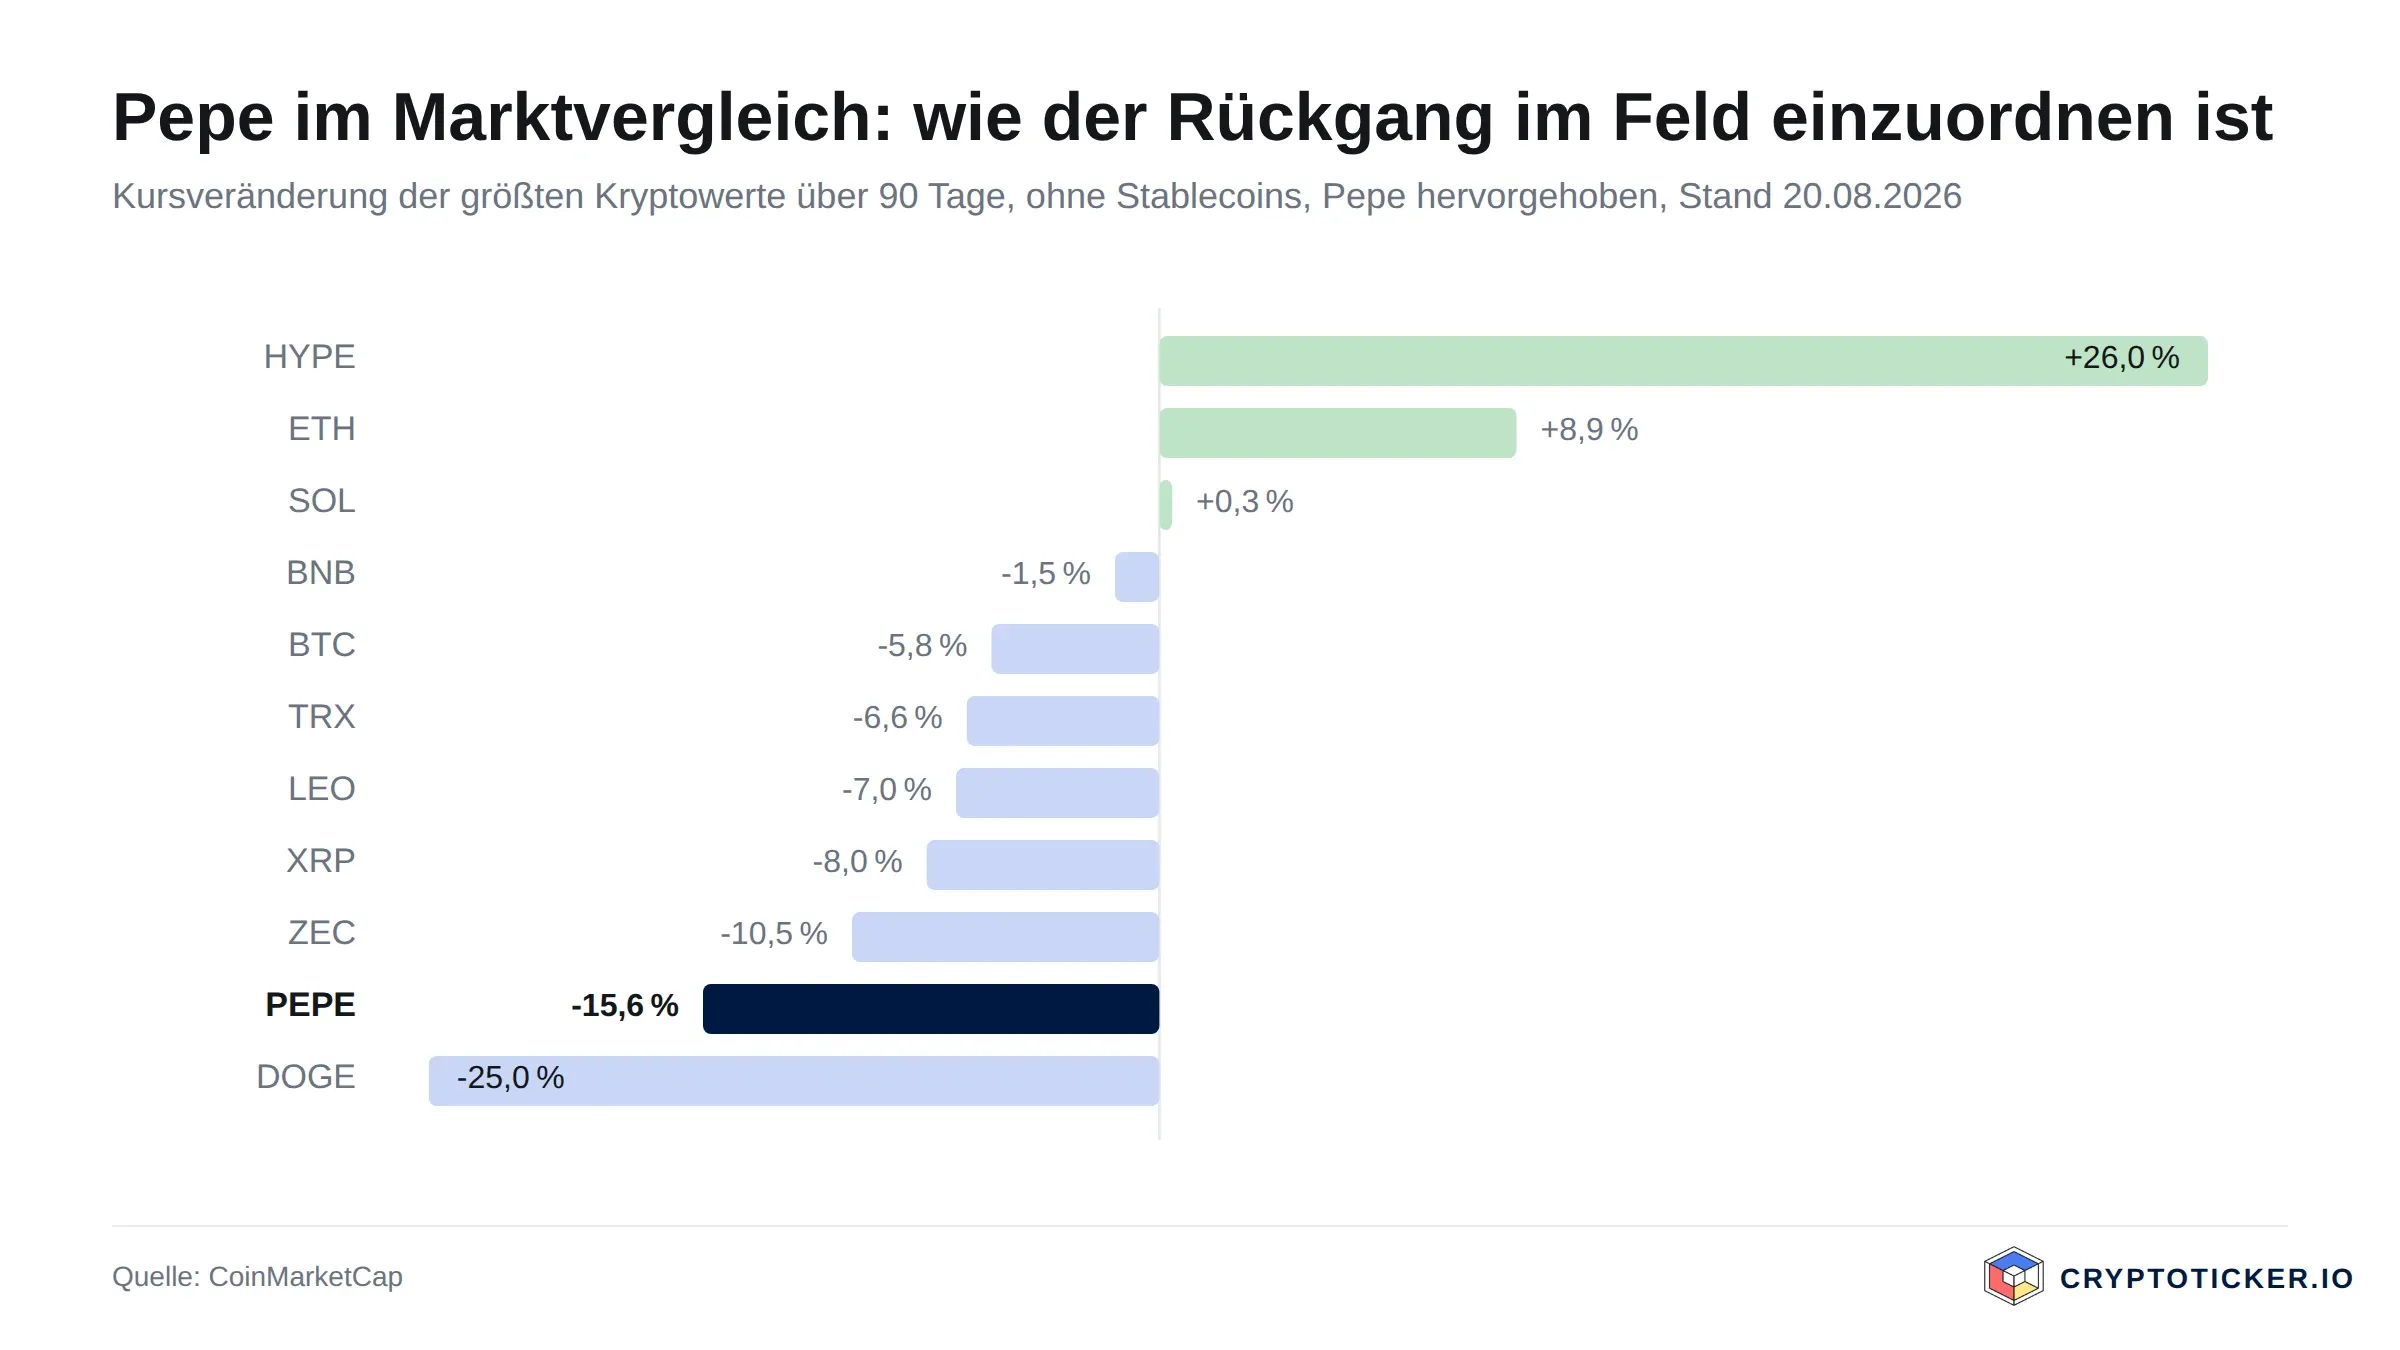 Pepe compared with the other large crypto assets over 90 days
Second, the missing fundamental story. PEPE has no utility application, no staking yield, no protocol roadmap, no cash flow basis. The price rises and falls solely with the attention flowing to the coin. When attention fades, the price fades. Bitcoin and Ethereum have a structural valuation base; PEPE has none.
Third, the competitive environment. New memecoins appear every week. Market share in fresh attention is a zero-sum game: what a new trending coin gains, an existing one loses. PEPE has held its place in the top 50, yet the next hype-driven rival can pull capital away at any time.
How to Buy PEPE at the Current Price
The simplest route runs through a regulated crypto exchange with a MiCA licence in the EU. Providers such as Kraken, Bitvavo or Coinbase offer PEPE against the euro, with purchase fees between 0.15 and 0.26 percent depending on volume. The spread and the withdrawal fee matter, because both eat directly into your return. You will find a comparison of the terms in the overview of the best crypto exchanges.
For longer-term holding the token belongs in your own wallet. Since PEPE is an ERC-20 token, any EVM-compatible self-custody works: software wallets such as MetaMask or Rabby, hardware wallets such as Ledger or Trezor. With a hardware wallet the private key stays offline, which is the more sensible solution for amounts above a few hundred euros. Regulated European providers are listed in the overview of the best regulated crypto exchanges.
One point matters for your entry price: PEPE trades at the weekend just as it does during the week, but volume typically collapses on Sunday. If you are building a larger position, spread it across several buy orders, ideally during active trading hours. And check before every purchase whether your provider actually lists the PEPE token on Ethereum and not a copy of the same name on another chain. The risk of confusion is high with memecoins.
So Is PEPE a Good Buy at the Current Price
In the short term the signs point to a plannable setup. At $0.00000316 the price sits 17.5 percent above the 50-day average of $0.00000269, three percent below the 200-day average of $0.00000325 and around 36 percent above the twelve-month low. That is a narrow trading zone with a clearly defined risk-reward ratio. Anyone hedging with discipline below the July low finds a plannable move here.
The long term requires a different answer. With no utility promise, no cash flow basis and a twelve-month loss of 75 percent, PEPE is no core holding. The coin is a highly speculative addition whose value consists entirely of attention. As such it belongs in the riskiest corner of a diversified portfolio, with a position size that makes a total loss bearable.
The assumption that the current rebound is the floor of a new cycle counts as refuted if the price falls sustainably below the 50-day average of $0.00000269 on a daily closing basis. Should PEPE drop under the twelve-month low of $0.00000232, the target shifts to $0.000002 and lower. Buying under this assumption always means one thing as well: defining a clear stop.
Buying PEPE: What You Take Away
The current PEPE price of $0.00000316 sits between the 50-day average at $0.00000269 and the 200-day average at $0.00000325. If you want to read the technical starting position in detail, you will find the target corridors in our PEPE price prediction. As a pure memecoin with no utility promise, PEPE is a highly speculative addition to a portfolio. To choose a suitable trading platform, the overview of the best crypto exchanges helps. For longer holding periods the token belongs in an EVM-compatible wallet, ideally a hardware solution. You can see which European providers are regulated for this in the overview of the best regulated crypto exchanges.Disclosure: some of the providers named in this article work with us through partner programmes. This has no influence on the price analysis or the assessment of the chart situation; the price data comes from a public market data source and can be verified there.
(As of August 20, 2026. This article is not investment advice. Prices and fee structures change; check the terms with the provider before you buy.)





 Bengali (Bangladesh) ·
  English (United States) ·