

Cardano trades at 0.1846 US dollars. That is 80.8 percent below the twelve-month high of 0.9631 dollars from 18 August 2025, and 28.5 percent above the twelve-month low of 0.1436 dollars set on 29 June 2026. The market capitalisation stands at roughly 6.9 billion dollars. Anyone looking at ADA today is looking at an asset that has lost three quarters of its value over a year and has since stabilised. Which leads to the question this article addresses: is Cardano a good buy at current prices?
The figures in this article were collected by cryptoticker.io on 11 August 2026 from the public market data interface operated by CoinGecko. From 365 daily closing prices we calculated the 50-day and 200-day exponential moving averages, the 14-day relative strength index, the twelve-month high and low, the changes over 30, 90 and 365 days and the average daily trading volume, using standard formulas. Any reader can reproduce these numbers from the same source.
Cardano price analysis: where ADA stands and which levels matter
Three levels frame the picture. The twelve-month low at 0.1436 dollars, reached on 29 June 2026, now sits 28.5 percent below the market, so buyers have already paid up meaningfully from the panic level. The 50-day exponential moving average at 0.1801 dollars has flipped: it capped the price for most of the spring, and ADA now trades 2.5 percent above it, a cushion thin enough to fall inside a single ordinary trading day.
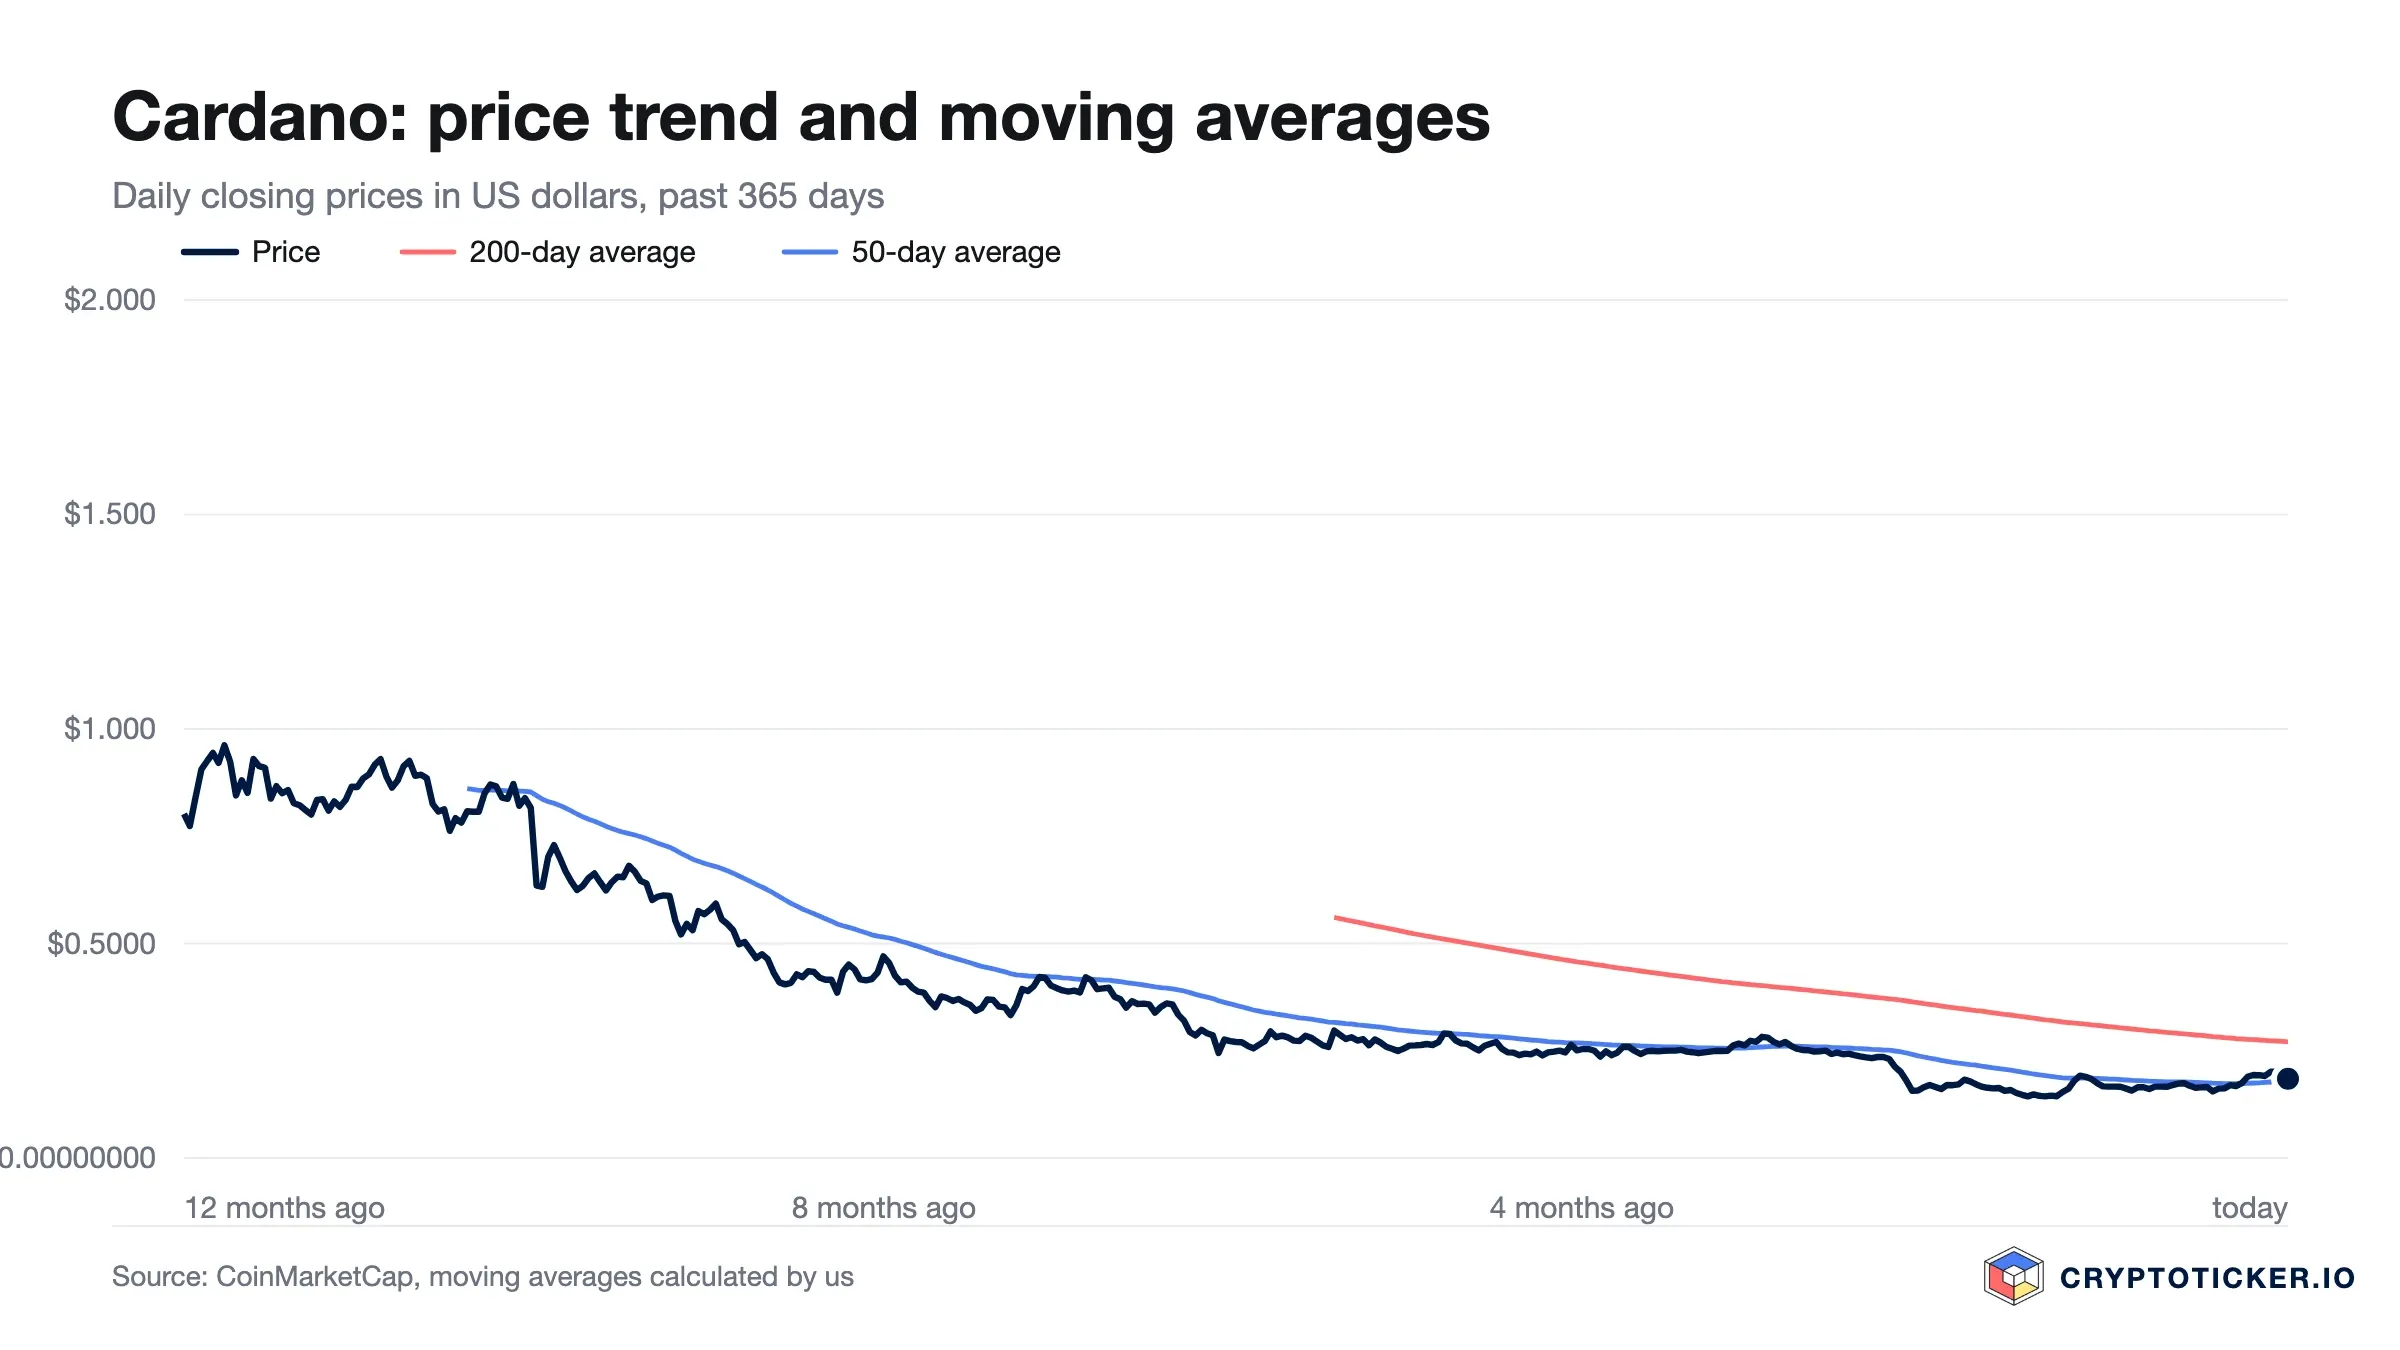 Cardano price and moving averages, calculated by us from CoinGecko daily closing prices
The third level is the 200-day exponential moving average at 0.2712 dollars, some 31.9 percent overhead. That gap is the most important number for anyone weighing an entry: closing it means a 47 percent advance, and until it closes the longer-term trend cannot be described as anything other than negative.
Over shorter windows the picture is more constructive than the annual figure implies. ADA has gained 14.0 percent over 30 days, while it is down 30.3 percent over 90 days and 76.1 percent over 365 days. The sequence matters more than any single figure: the deepest damage came earlier, and the most recent month has run against the direction of the year. Our rolling view on these levels is set out in the Cardano price prediction.
Is the Cardano downtrend broken or merely interrupted?
A downtrend is broken when a market stops making lower lows and reclaims the averages that defined the decline. Cardano has done the first and half of the second.
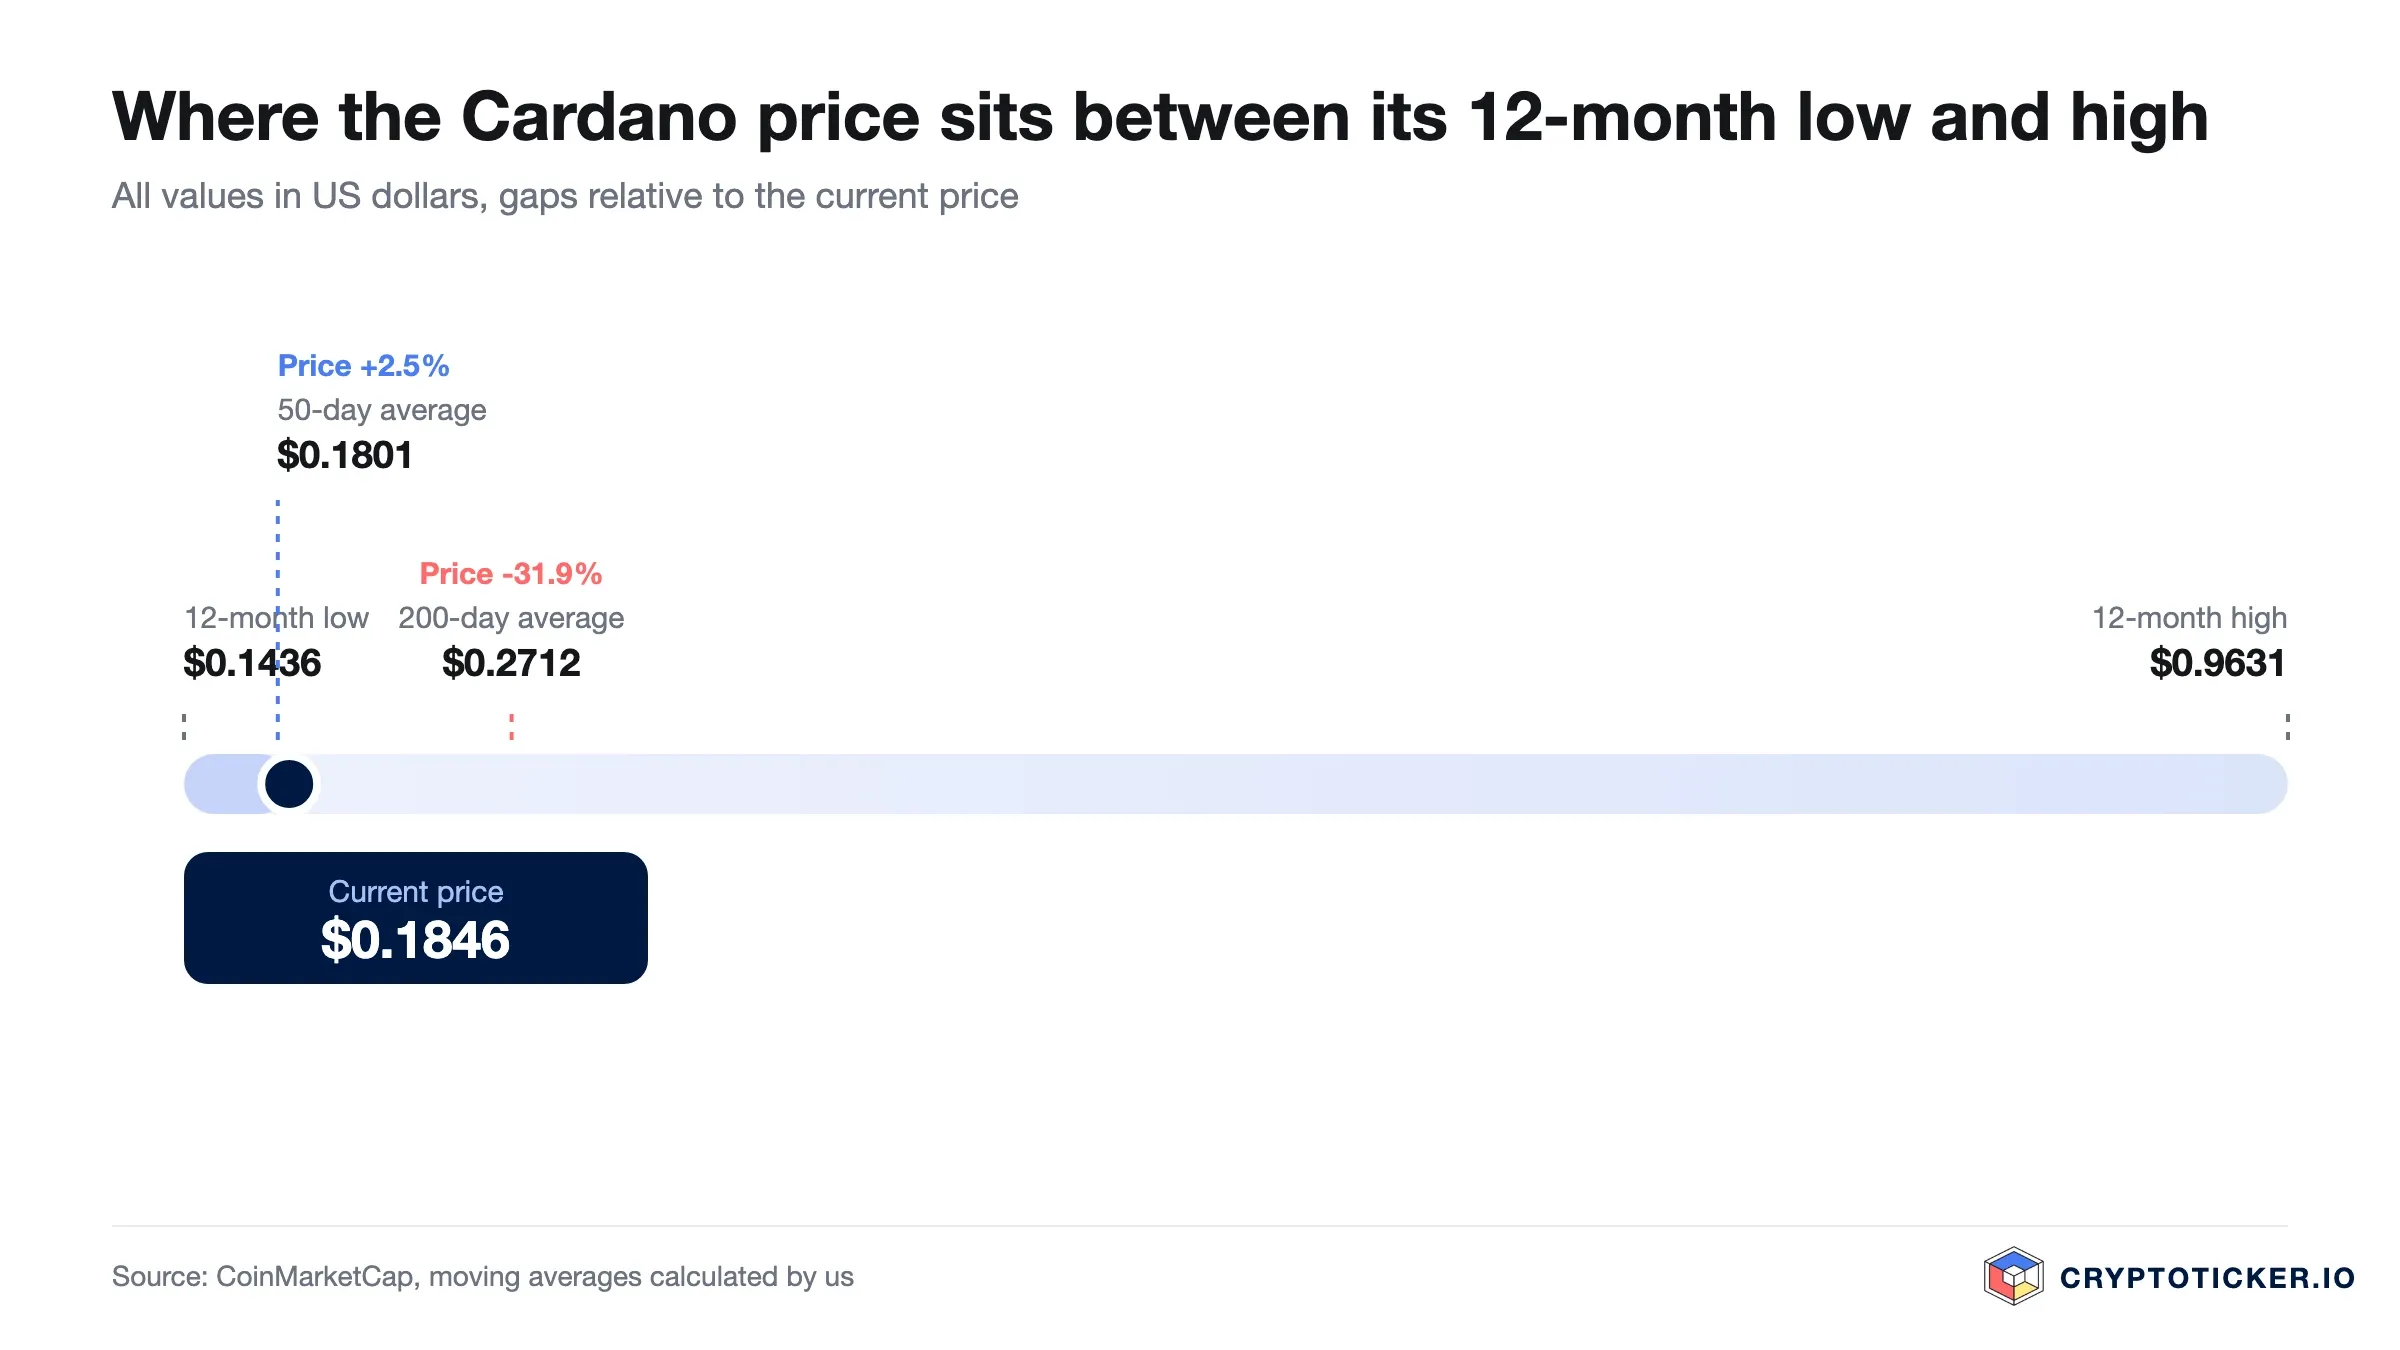 The Cardano price relative to its 12-month low, high and both moving averages
The lower-low sequence stopped on 29 June 2026 at 0.1436 dollars, and the price has held above that mark since. That is a change of behaviour rather than a change of trend, because markets stop falling long before they start rising.
On the averages the evidence is split. Reclaiming the 50-day line at 0.1801 dollars matters for a position lasting weeks, while the 200-day average at 0.2712 dollars has not been challenged. In our view this is most plausibly read as a base-building phase rather than a reversal, though such phases fail regularly and are only identified with certainty in hindsight. The 90-day change of minus 30.3 percent underlines the point: a market down 30 percent over a quarter and up 14 percent over a month is still net lower.
What RSI and moving averages mean for a Cardano entry
The 14-day relative strength index sits at 53.2. Below 30 is conventionally oversold, above 70 overbought, and the zone between 45 and 55 neutral. Cardano is in the middle of that neutral band.
For an entry decision this is more informative than it first appears. An RSI of 53 after a 76 percent annual decline indicates that selling pressure has genuinely eased, and equally that there is no oversold signal to buy into. Investors who wait for extremes find nothing actionable in either direction.
The relationship between the averages adds a constraint. For it to normalise, the 50-day line must rise for months, and it can only rise if the price stays above it. This is the mechanical reason why a recovery in an asset like Cardano tends to be slow even when it works.
What Cardano trading volume reveals about demand
Average daily trading volume over the past seven days was 352 million dollars, against 323 million dollars over thirty days. The seven-day figure is 9.0 percent higher, so participation has picked up modestly as the price has risen.
The comparison against the full year matters more. Median daily volume over 365 days was 406 million dollars, which places current activity roughly 13 percent below that median. The recovery of the past month has taken place on lighter turnover than the year's typical day.
This is the most cautionary data point in the analysis. Rising prices on falling volume are the classic signature of a market where sellers have stepped back rather than one where buyers have stepped in. The gain of the past 30 days appears to have been achieved largely through the absence of supply, and such an advance is fragile when supply returns.
The counter-argument deserves weight. Volume across the crypto market has been subdued through the summer of 2026, so a coin trading 13 percent below its own annual median is no outlier. We regard this as a reason for caution about the durability of the move rather than evidence that it is artificial.
Structural factors that speak for Cardano: supply, usage and regulation
The first is supply mechanics. Cardano has a hard cap of 45 billion ADA, of which roughly 36 billion circulate. New issuance comes from a reserve paying out at a declining rate, so the annual rate of supply expansion falls over time. For a long-term holder this differs materially from an asset with uncapped issuance, because the dilution that has to be outrun shrinks year after year.
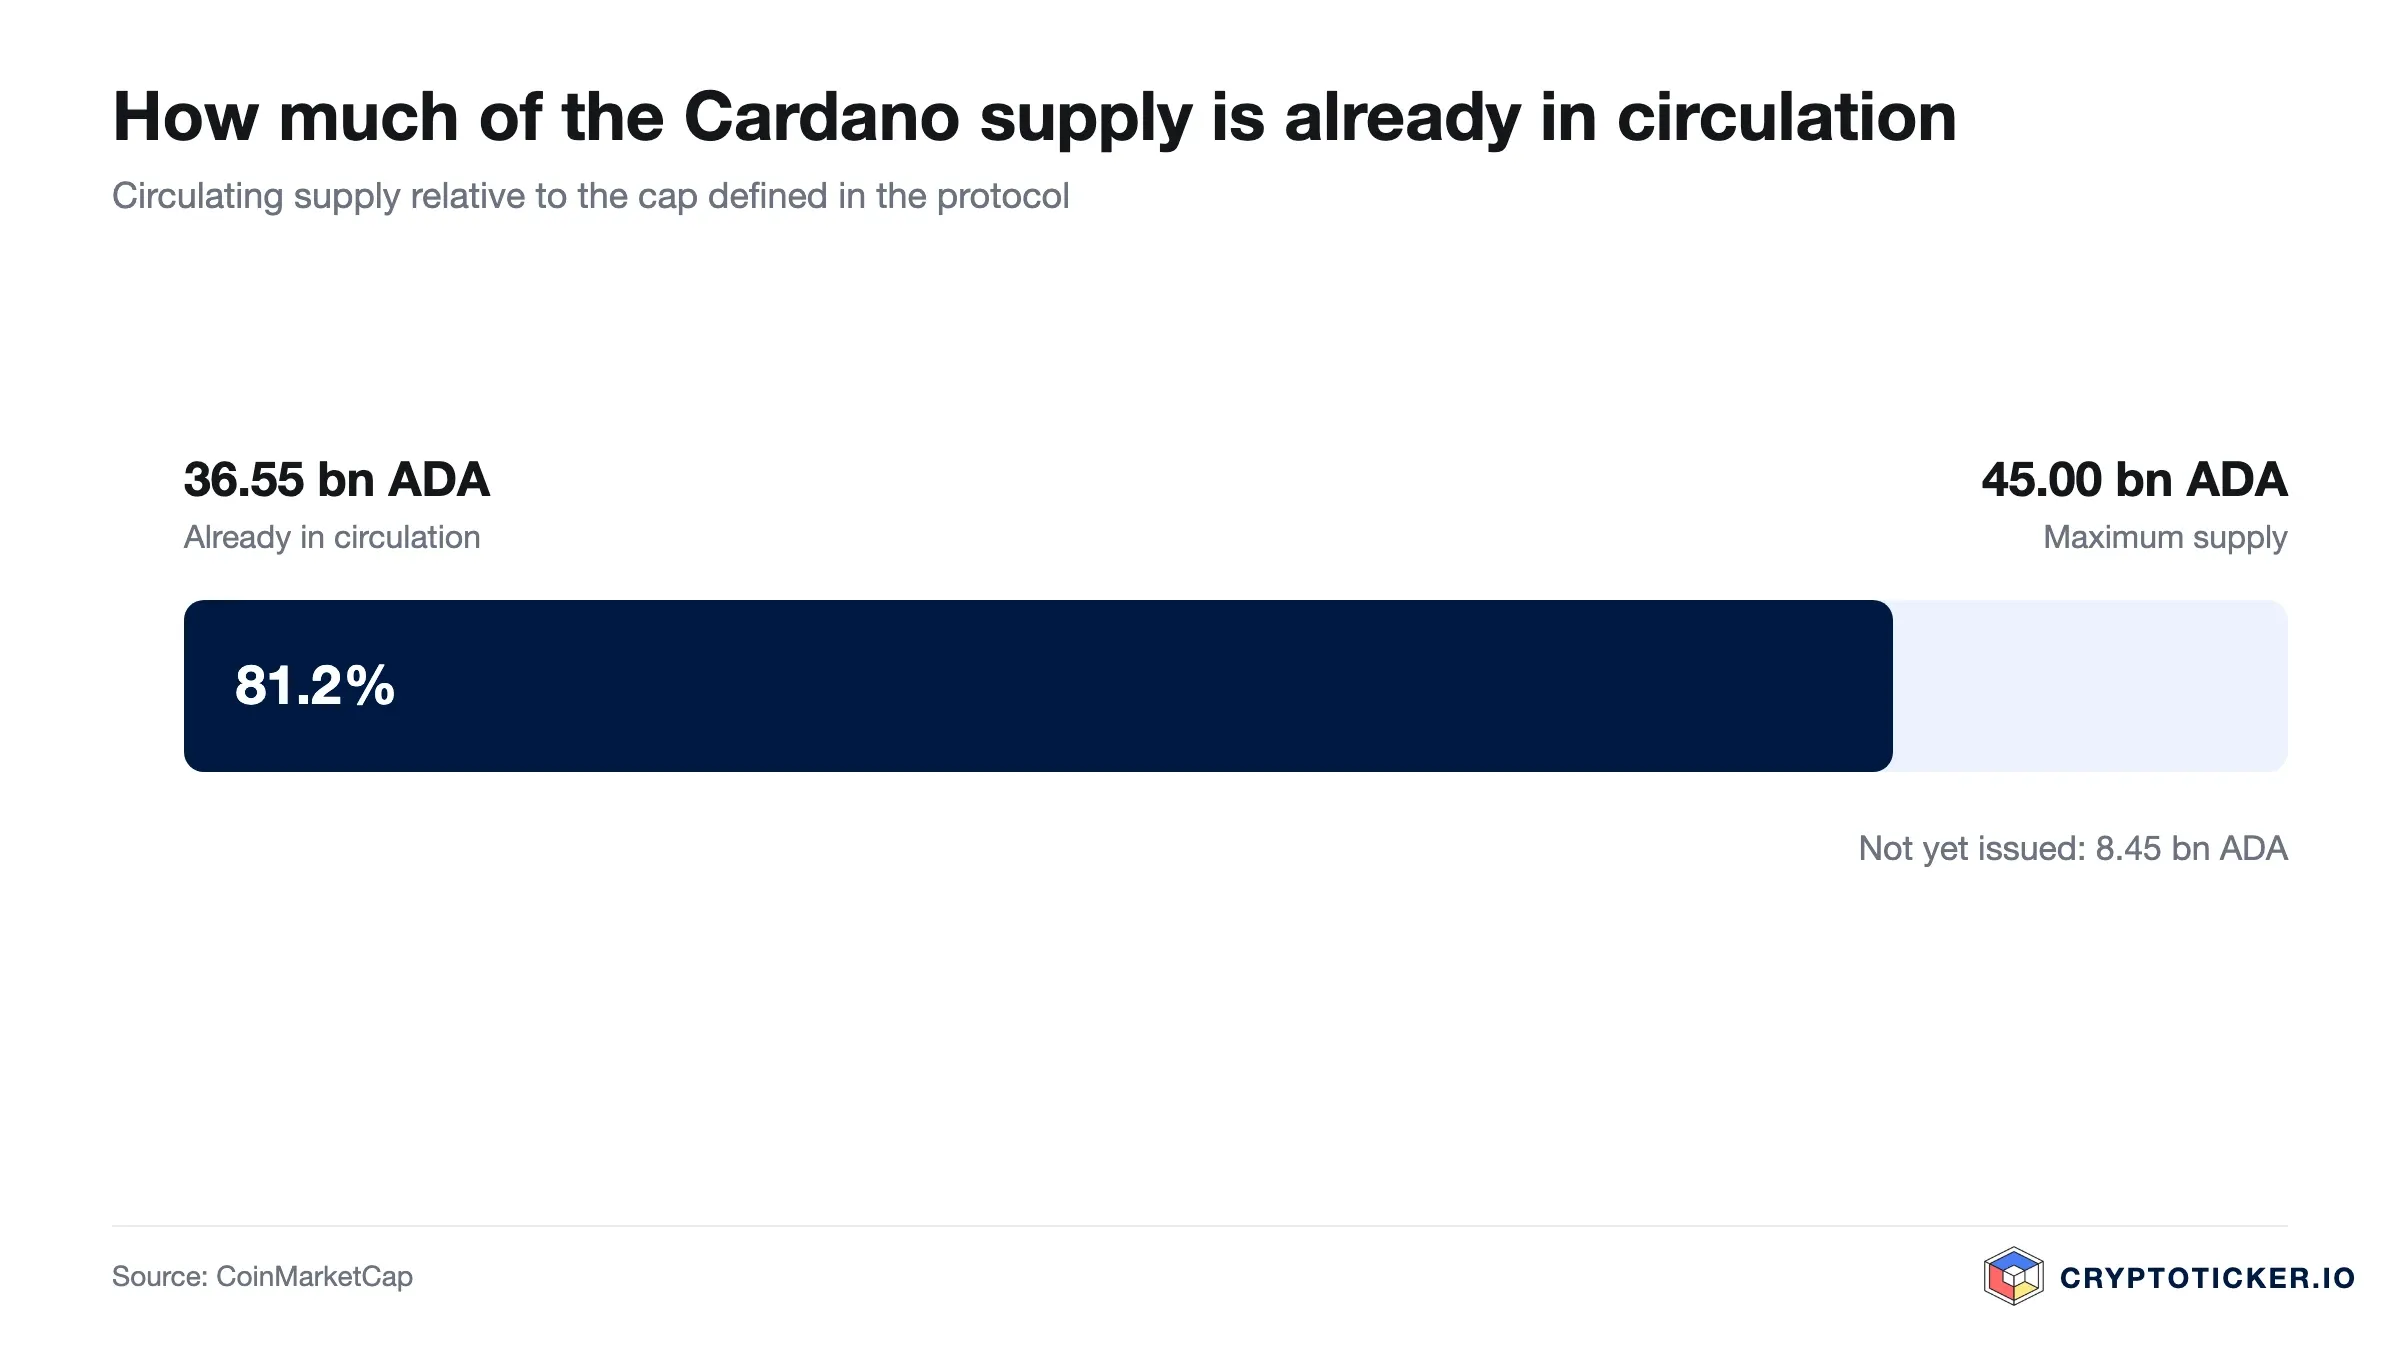 Cardano supply structure according to CoinMarketCap data
The second is staking. ADA can be delegated to a stake pool without transferring custody and without a lock-up period, a design documented on the project's own stake pool delegation page. Delegation stays liquid, so delegated coins are not removed from the market, but the arrangement correlates with a holder base oriented towards longer holding periods. Protocol documentation is maintained at docs.cardano.org.
The third is the European regulatory environment. Under the Markets in Crypto-Assets regulation, which the European Securities and Markets Authority documents in its MiCA activities section, an established asset such as ADA can be offered by licensed European providers under a harmonised rulebook. That does not make ADA a better investment on its merits, but it does mean the risk of an abrupt delisting for regulatory reasons is lower than for assets whose classification remains contested.
What none of these factors provide is a mechanism that translates directly into price. They describe the conditions under which demand could express itself; they do not create the demand.
Three arguments for buying Cardano at current prices
The price has stopped falling, and it has been more than a month. The twelve-month low was set on 29 June 2026 and has held, and ADA has since added 28.5 percent and moved back above its 50-day average. In a market that had been making new lows repeatedly, six weeks without one is worth registering.
The 200-day average defines a visible upside reference. At 0.2712 dollars it sits 47 percent above the current price. This is not a forecast. It is the level at which the long-term trend would cease to be negative, which makes it the natural reference for anyone sizing a position.
Structural characteristics support a long holding period. Capped supply, a declining issuance schedule and availability through regulated European venues mean a multi-year position does not depend on continuous positive news. Investors comparing venues on fees and jurisdiction will find the criteria in our crypto exchange comparison.
Three arguments against buying Cardano at current prices
Volume does not confirm the recovery. Turnover runs 13 percent below the annual median. The advance of the past 30 days has been carried by the withdrawal of sellers rather than an influx of buyers, and a move built on absent supply reverses as soon as supply reappears.
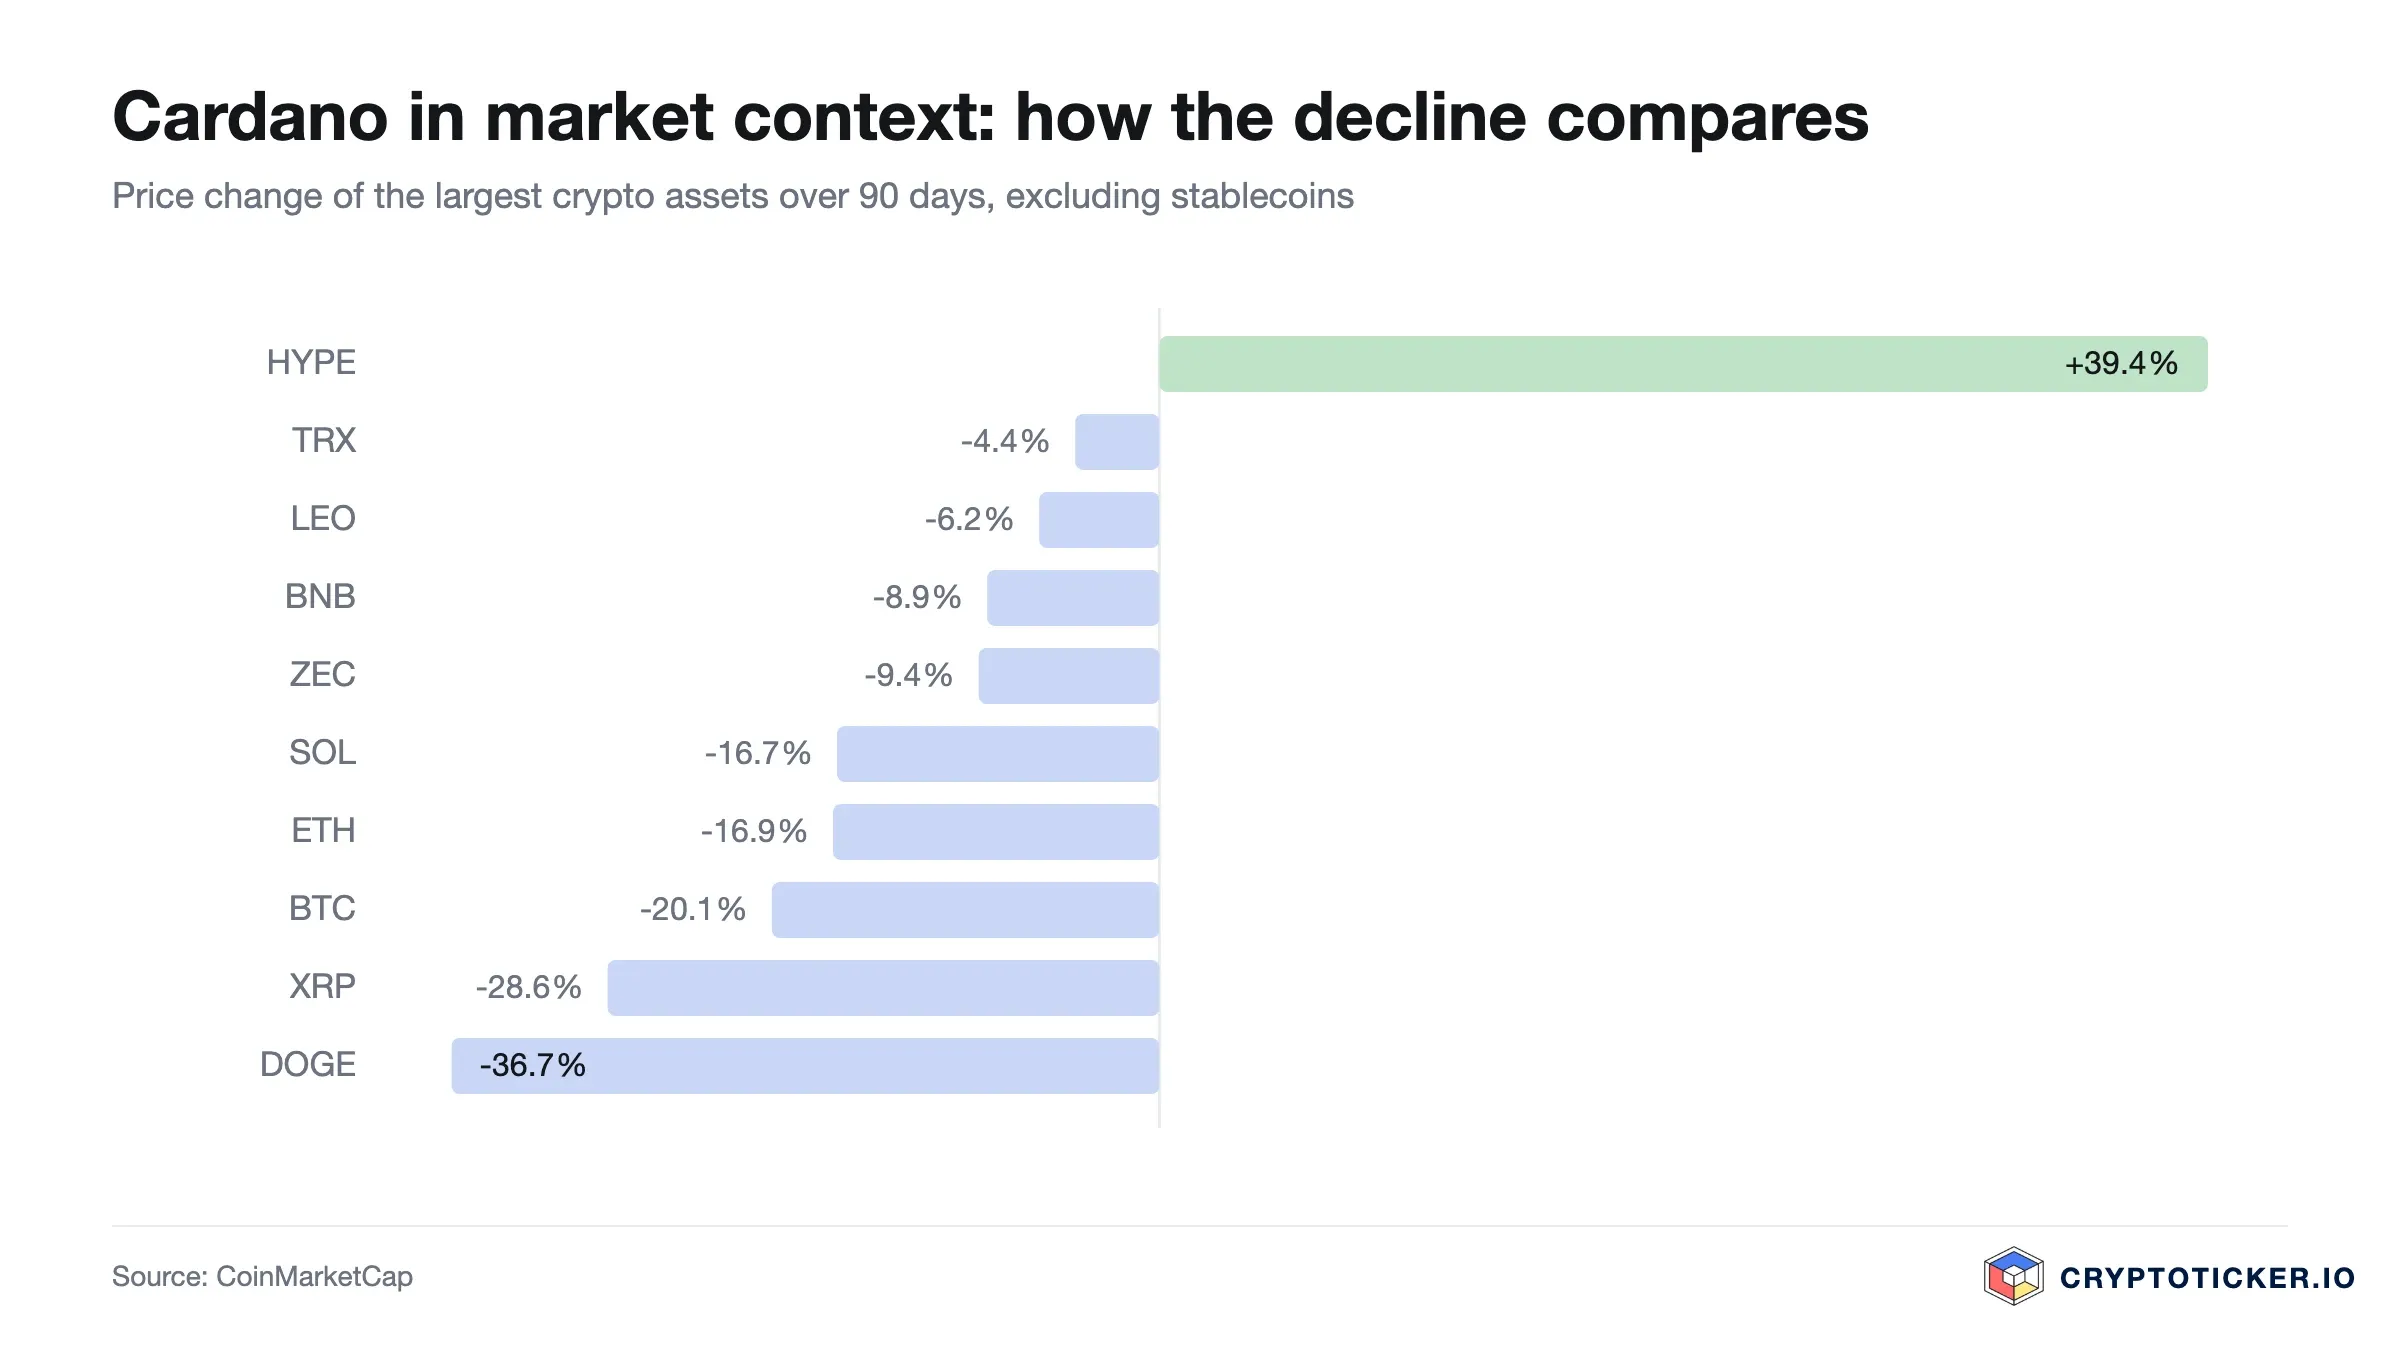 Cardano compared with the other large crypto assets over 90 days
The distance to the long-term trend is substantial. Closing the 31.9 percent gap to the 200-day average requires a 47 percent advance. Until then, every rally in Cardano is a counter-trend move by definition.
The technical picture offers no edge. An RSI of 53.2 is neutral. There is no oversold reading to exploit and no momentum to follow. An investor buying here is expressing a view about Cardano's future rather than acting on a signal the market is providing, and that distinction matters for position sizing.
How to buy Cardano at current prices: costs, custody and providers
Trading costs. Spot fees at European exchanges typically fall between 0.1 and 1.5 percent per trade depending on venue and order type, and the spread on ADA adds to that. Our reviews set out the fee structures, for example in the Kraken review and the Bitpanda review. Fees change, so verify them with the provider before you trade.
Regulatory standing. For investors in the European Economic Area, a provider authorised under the European framework simplifies tax documentation and the question of what happens if a venue runs into difficulty. Our comparison of regulated crypto exchanges covers which venues hold which permissions.
Custody. ADA held at an exchange is a claim against that exchange; ADA in a wallet you control is not. For a position intended to last years, self-custody removes counterparty risk at the cost of managing a seed phrase properly, a trade-off examined in our hardware wallet comparison. Delegating to a stake pool does not require giving up custody, so self-custody and staking are not mutually exclusive.
Since the analysis above identifies no timing signal, an investor treating the case for Cardano as a multi-year one has little reason to establish the whole position in one transaction.
So is Cardano a good buy at current prices?
Over the short term, measured in weeks to a few months, the data does not support a decisive position. RSI at 53.2 is neutral, the cushion above the 50-day average is within ordinary daily volatility, and volume runs below the annual median. From our perspective this is a phase in which patience costs little, since nothing in the configuration suggests an opportunity that disappears within days.
Over the long term, measured in years, the case rests on different considerations. At 80.8 percent below the twelve-month high, an investor buys an asset already repriced severely rather than one priced for optimism, and the capped supply works in favour of a long holder. This remains plausible but unproven, and it depends on adoption that has not yet shown up in the price.
The conditions under which this reading would be falsified can be stated precisely. The base-building assumption fails if Cardano closes below the twelve-month low of 0.1436 dollars for several consecutive days, particularly on rising volume, because that would re-establish the sequence of lower lows that stopped in June. It is confirmed if ADA holds above the 50-day average at 0.1801 dollars while daily volume returns above the annual median of 406 million dollars, since that combination indicates buyers entering rather than sellers merely pausing.
Neither scenario is a recommendation, and this article does not offer one. What the data supports is a description of the conditions and of the levels at which the current interpretation would have to be abandoned.
What to take away on Cardano
Cardano has reclaimed its 50-day average at 0.1801 dollars but remains 31.9 percent below the 200-day average. The trend is interrupted rather than reversed, and the levels that would change that are tracked in our Cardano price prediction. The recovery of the past 30 days ran on volume 13 percent below the annual median. Confirmation requires turnover above 406 million dollars a day, and venues differ widely in what that costs you, as our crypto exchange comparison shows. For a position meant to last years, custody matters as much as the entry price, a trade-off set out in our hardware wallet comparison.Disclosure: Some of the providers mentioned in this article work with us through partner programmes. This has no influence on the price analysis or on the assessment of the chart situation; the price data comes from a public market data source and can be verified there.
(As of 11 August 2026. This article is not investment advice. Prices, fees and terms change; check them with the provider before every purchase. Crypto assets are subject to high price volatility, and a total loss is possible.)
Transparency note: This article was produced with the assistance of artificial intelligence and reviewed by our editorial team before publication. All figures and claims were checked against the primary sources linked in the text. The feature image was generated with AI.




 Bengali (Bangladesh) ·
  English (United States) ·