
 1 hour ago
6
1 hour ago
6 
TLDR
Ethereum is trading around $2,502 on Oct. 11, holding above its rising trendline from the June low. U.S. spot Ether ETFs lost $56.1 million on Oct. 9, their ninth straight day of net outflows. The RSI sits at 40.85 and the MACD remains bearish, showing weak short-term momentum. Key support is at $2,450-$2,500, with resistance at $2,650-$2,750. Analyst Crypto Patel targets $5,000-$10,000 for ETH and watches $2,100-$1,800 as his next accumulation zone.Ethereum is trading around $2,502 on the Oct. 11 Binance daily chart. Price opened near $2,503.85, reached about $2,508.31, dipped to $2,497.12, and closed almost flat. ETH is trying to stabilize after a sharp pullback from the late-September highs.
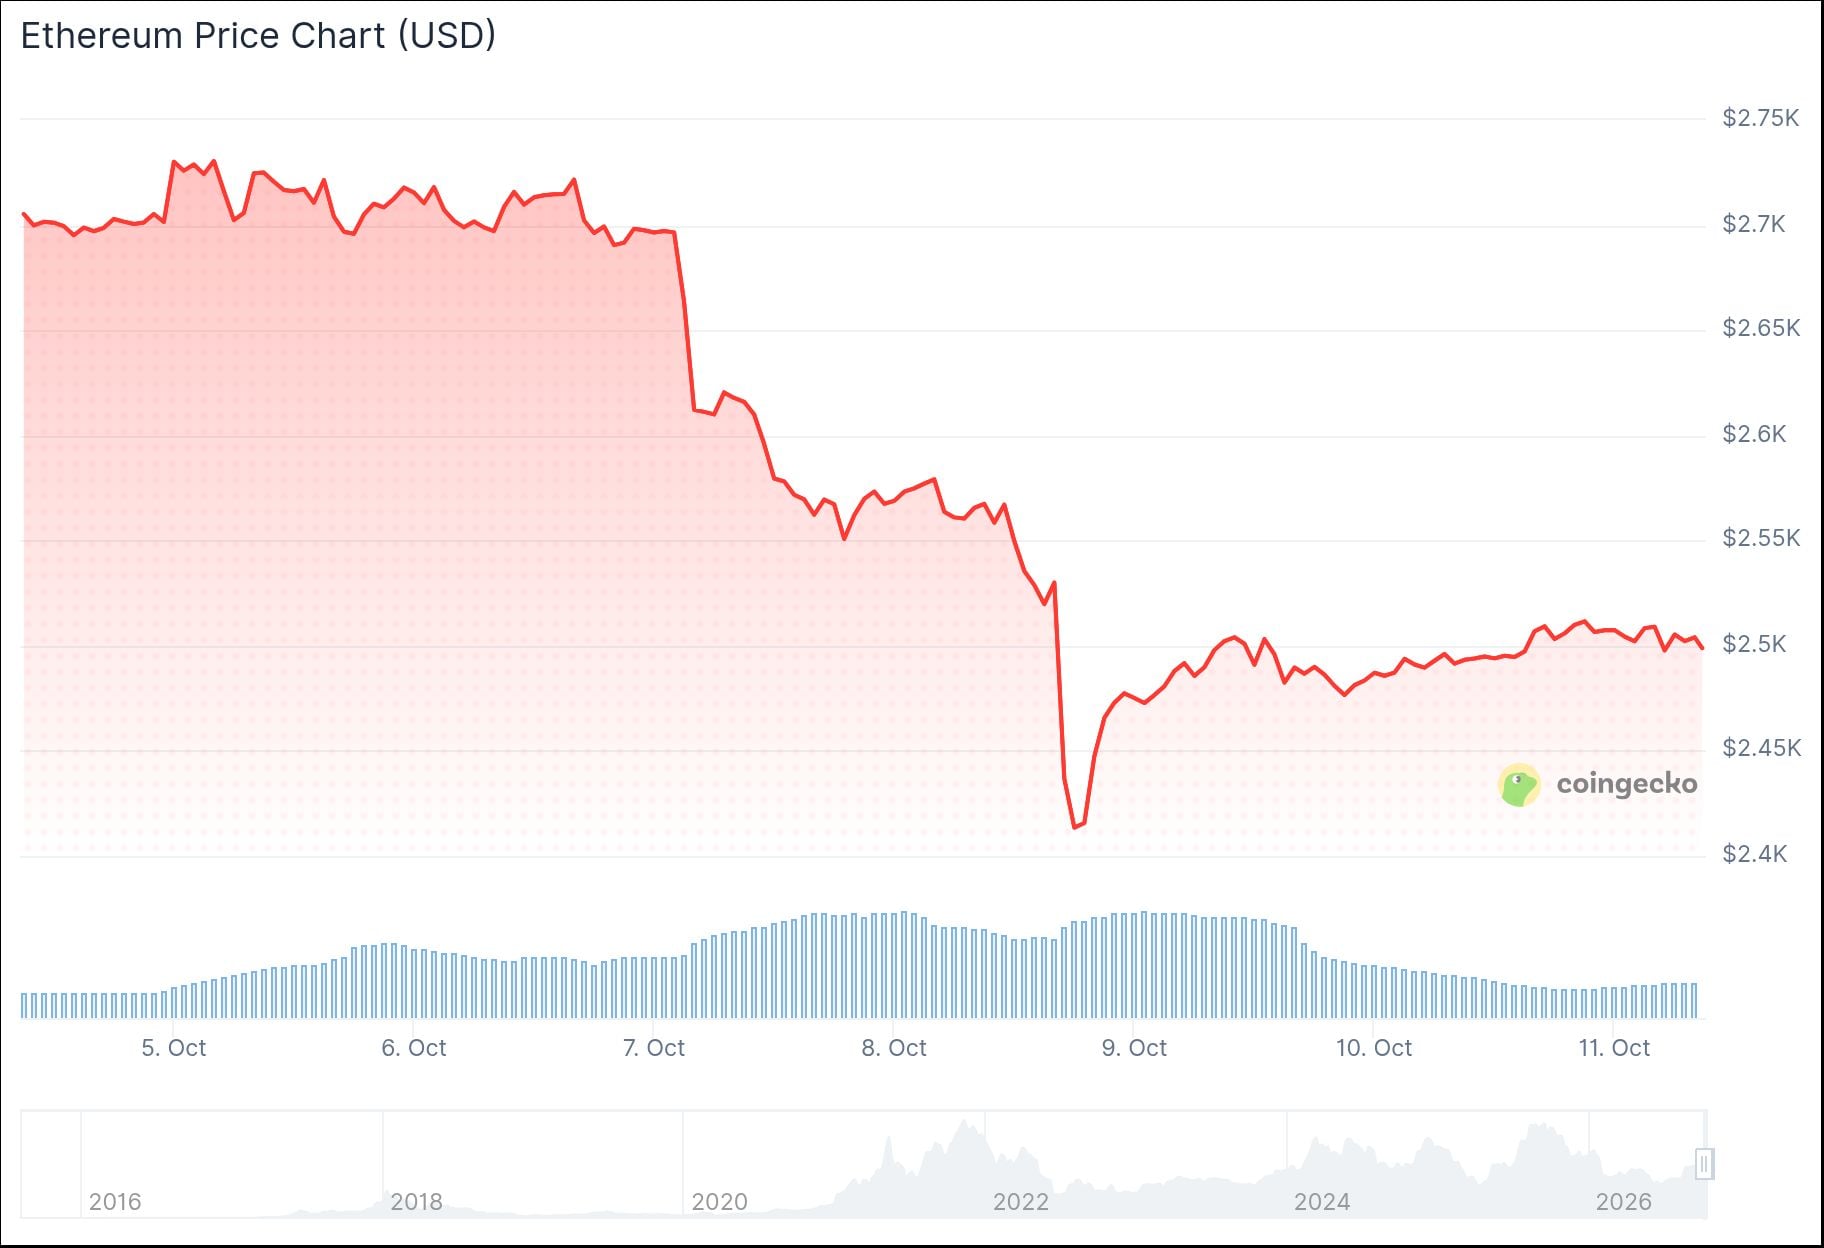 Ethereum (ETH) Price
Even after the recent weakness, ETH still trades above the broader rising trendline drawn from the June low. The uptrend from mid-2026 remains intact, but the short-term tone has weakened.
ETF Outflows Extend
U.S. spot Ether ETFs recorded a $56.1 million net outflow on Oct. 9. That extended a run of redemptions that began after Sept. 28, and marks nine straight trading sessions of net outflows.
The Oct. 6 session was the largest in the streak, with $201.9 million leaving the funds. On Oct. 7, another $160.9 million followed. Smaller daily outflows since then have kept the total negative.
Longer-term numbers remain positive. Farside data shows cumulative net inflows of about $13.289 billion across the U.S. spot Ether ETF group.
BlackRock’s ETHA leads with $12.792 billion in cumulative inflows. Fidelity’s FETH has added $2.348 billion, and Grayscale’s mini product ETH has added $2.023 billion. Grayscale’s legacy ETHE shows cumulative outflows of about $5.472 billion.
Chart Analysis
ETH sits close to the $2,450-$2,500 support region. This area lines up with the top of the earlier breakout zone and the rising trendline. The first major resistance area is around $2,650-$2,750, where sellers stepped in during the latest rally.
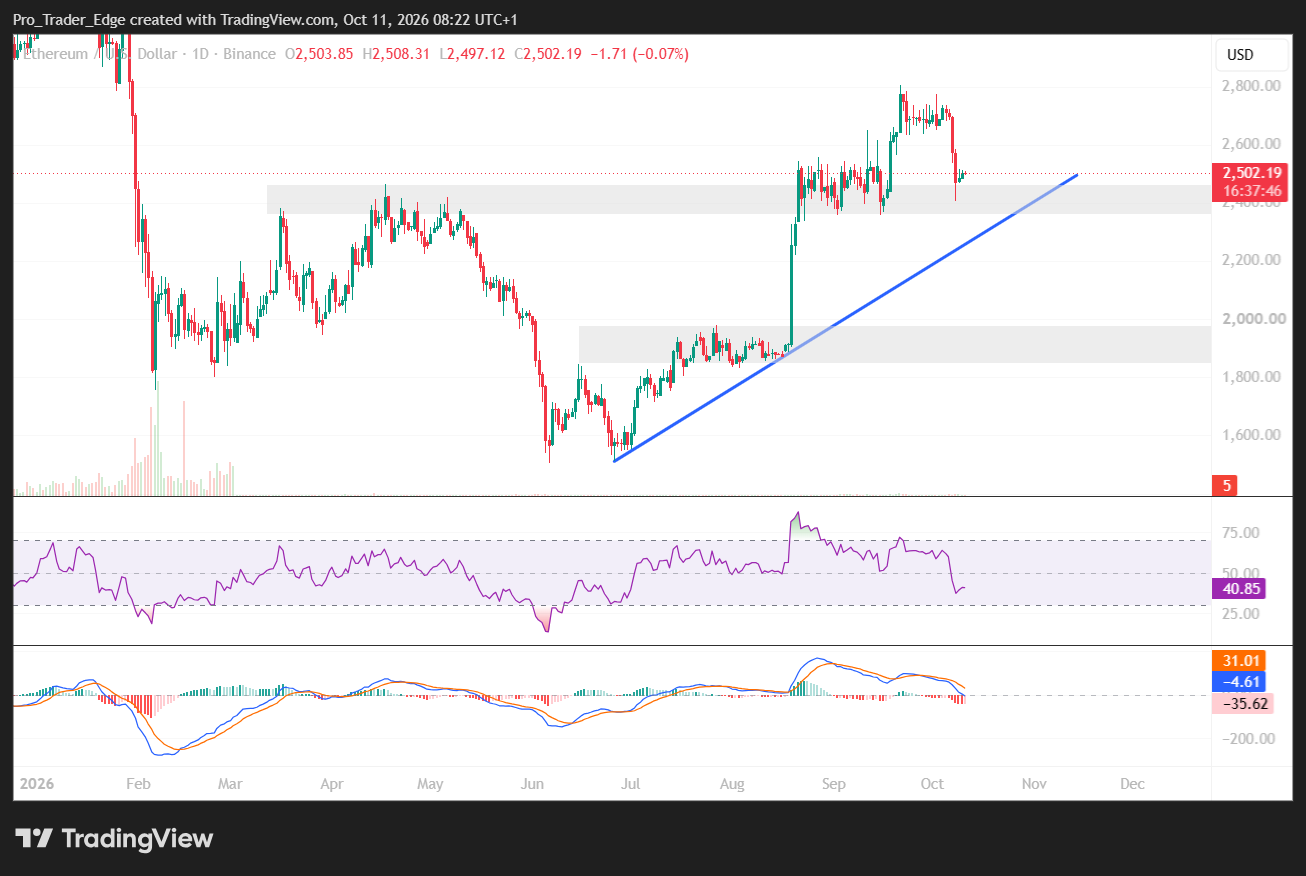 Source: TradingView
Momentum indicators have cooled. The RSI is at 40.85, below neutral, and the MACD histogram is still negative. If support holds, ETH could work back toward $2,650-$2,750. If it breaks, the next major area is $1,850-$1,950, the base before the late-summer breakout. The level to watch next is $2,450-$2,500.
Analyst Crypto Patel has shared a bullish long-term view. He says ETH has moved into a bullish higher-time-frame zone and targets $5,000, $7,000 and $10,000 in a 2026-2027 roadmap. He notes ETH has rallied about 85% from his $1,600-$1,200 accumulation zone.
ETHEREUM $10,000 TARGET: THE NEXT BIG ACCUMULATION OPPORTUNITY COULD BE NEAR! 🚀$ETH has shifted into a bullish HTF zone, and my 2026–2027 roadmap targets $5,000–$10,000.
ETH has already rallied approximately 85% from our $1,600–$1,200 accumulation zone. That move has played… pic.twitter.com/29cVeACeqe
— Crypto Patel (@CryptoPatel) October 10, 2026
Patel is now watching for a retest. His next accumulation zone is $2,100-$1,800, which he says lines up with a potential higher low, a bullish order block and a fair value gap. He plans to wait for bullish confirmation before considering an entry.
Data from analyst Ali Charts shows whales have been buying. Over the past 72 hours, they accumulated nearly 15,000 BTC, more than 166,000 ETH and around 45 million XRP.
WHALES BOUGHT THE DIP
Over the past 72 hours, whales have accumulated:
• Nearly 15,000 $BTC
• More than 166,000 $ETH
• Around 45 million $XRP pic.twitter.com/8MG27RX4Ga
— Ali Charts (@alicharts) October 10, 2026
ETH was trading near $2,502 on Oct. 11, with the $2,450-$2,500 support zone in focus.
The post Ethereum (ETH) Price: ETH Holds Near $2,500 as Whales Add 166,000 ETH Over 72 Hours appeared first on CoinCentral.





 Bengali (Bangladesh) ·
  English (United States) ·