
 1 hour ago
7

Key Takeaways
0.618 Fib near $69,062 lost on prior candle. Daily RSI at 21.5 matches June oversold extreme. Next Fib support sits around $64,069. Candle still open; today’s low $65,960 is pivot.The breakdown extends a November decline that has already taken out two Fibonacci levels in a week, and it arrives one day after the bounce off a key Fib level on softer US PPI failed to hold. On the Binance BTC/USDT daily chart, price is now sandwiched between a cluster of overhead resistance and the last retracement level before the full move is unwound.
Two Fib levels gone in one week
The retracement grid is drawn from the late-October swing high near $87,429 down to the early-July low close to $57,709, and the sequence of levels lost inside it matters more than any single one. Bitcoin gave up the 0.5 retracement close to $72,569 earlier in the week, then cut through the 0.618, the so-called golden pocket near $69,062, on Thursday’s candle without pausing. Friday’s session opened at $68,314 and managed a high of only $68,446 before sellers took over again, a gap of just $132 between open and high. There has been no retest of the broken $69,062 level from below; buyers have not got close enough to attempt one.
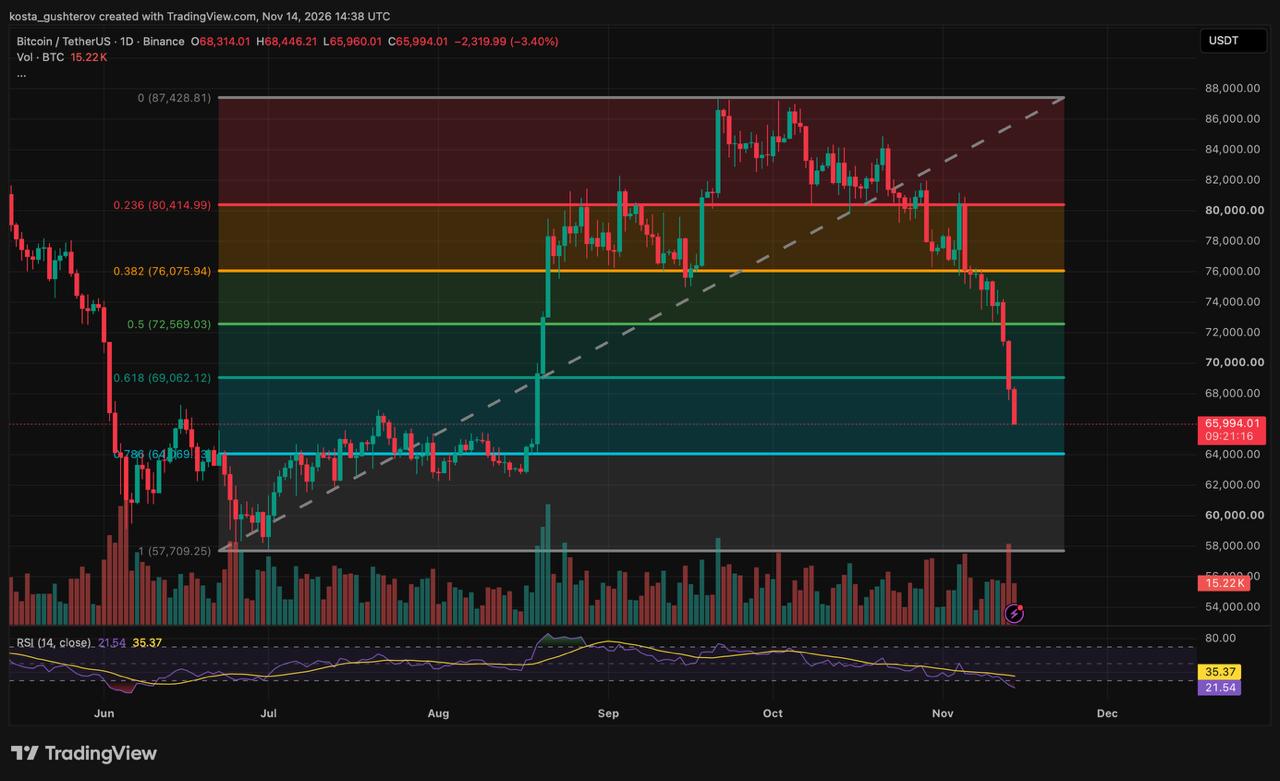 BTC/USDT daily (Binance), Nov 14, 2026: price trades below the broken 0.618 Fib with the 0.786 retracement around $64,069 as the next level below. Source: TradingView.
Volume tells the same story from a different angle. The 15.22K BTC traded so far is lighter than the red spikes that marked the early-November breakdown. Price is falling on less participation than it did a week ago, which fits a market grinding lower rather than one being sold in a panic, a distinction Coindoo examined when volatility stayed muted through the earlier legs of this decline.
The RSI has only been here once this year
The daily RSI (14) sits at 21.54, well below its signal line at 35.37. On this chart the only comparable reading came during the mid-June capitulation, when the indicator reached the same ~21–22 zone. That episode is the reference point for the bullish side of the argument: downward momentum stalled almost immediately afterwards and price staged a local relief bounce.
Oversold is a description of speed, not a floor. An RSI in the low 20s says sellers have moved price a long way in a short time; it does not say they have finished. What gives the reading some weight here is where price has landed while posting it.
Price is entering the July-August shelf
Below the broken $69,062 level, the next Fibonacci reference is the 0.786 retracement around $64,069. Between the two sits the July and August 2026 consolidation range, a multi-week band roughly between $64,000 and $66,500 where Bitcoin accumulated before the vertical breakout in late August. Friday’s low at $65,960 is inside the top edge of that band.
That overlap is the first real historical cushion since the breakdown began. It is also why the 0.786 level matters beyond the Fibonacci maths: around $64,069 is close to the centre of that shelf, so a Fib target and a horizontal memory level sit in the same place. Friday’s low stopped roughly $1,900 above it.
Path one: the flush to the 0.786
The daily structure is a steep, uninterrupted run of red candles with almost no upper wicks, and Friday’s session has shown seller control from the open. Under this reading, the gap between today’s low and the 0.786 level is simply unfinished business, and price continues down to test around $64,069 and the surrounding $64,000 consolidation memory before any serious buyer absorption appears. A daily close below $65,960 would keep that path active over the following 24 to 48 hours.
Path two: the oversold snap-back
Here the June RSI precedent and the July-August shelf do the work. If buyers hold Friday’s $65,960 floor, or allow a quick wick down toward $64,069 and then reclaim $66,000, the relief move has clearly defined ceilings: first the session open at $68,314, then a backtest of the broken 0.618 near $69,062 from below, which would now be acting as resistance rather than support. This reading does not reach for anything beyond that; its upside is capped at the levels that failed this week.
Neither path is a forecast. Both depend on how the current candle closes, and with a little over nine hours left in the session, the close is the missing piece.
Levels for the next 24 to 72 hours
Overhead, the first cap is the $68,314-$68,446 band formed by Friday’s open and high, followed directly by the broken 0.618 near $69,062. The pivot is Friday’s intraday low at $65,960: holding above it keeps the bounce case alive, closing below it hands the initiative back to the downside path. Support is the 0.786 Fib around $64,069, which doubles as the middle of the July-August consolidation shelf.
The bigger-picture caveat applies to both paths. Everything above is drawn from a single daily chart in the middle of a multi-week decline that has already retraced most of the July-to-October advance. A bounce from $64,000 and a continuation through it are both consistent with the broader structure; the levels tell traders where the argument will be settled, not which way.
Disclaimer: This article is a technical analysis of the Bitcoin price based on a single daily chart and is provided for information purposes only. It is not investment advice, a recommendation to buy or sell any asset, or a prediction of future price movements. Fibonacci levels, indicator readings and the scenarios described are tools for framing possible outcomes, not guarantees. Cryptocurrency markets are volatile and you can lose some or all of your capital. Do your own research and consult a licensed financial adviser before making any trading decision.
The post Bitcoin Price Dips Under $66,000 as Golden Pocket Gives Way appeared first on Coindoo.





 Bengali (Bangladesh) ·
 English (United States) ·