 10 hours ago
9
10 hours ago
9 
Key Takeaways
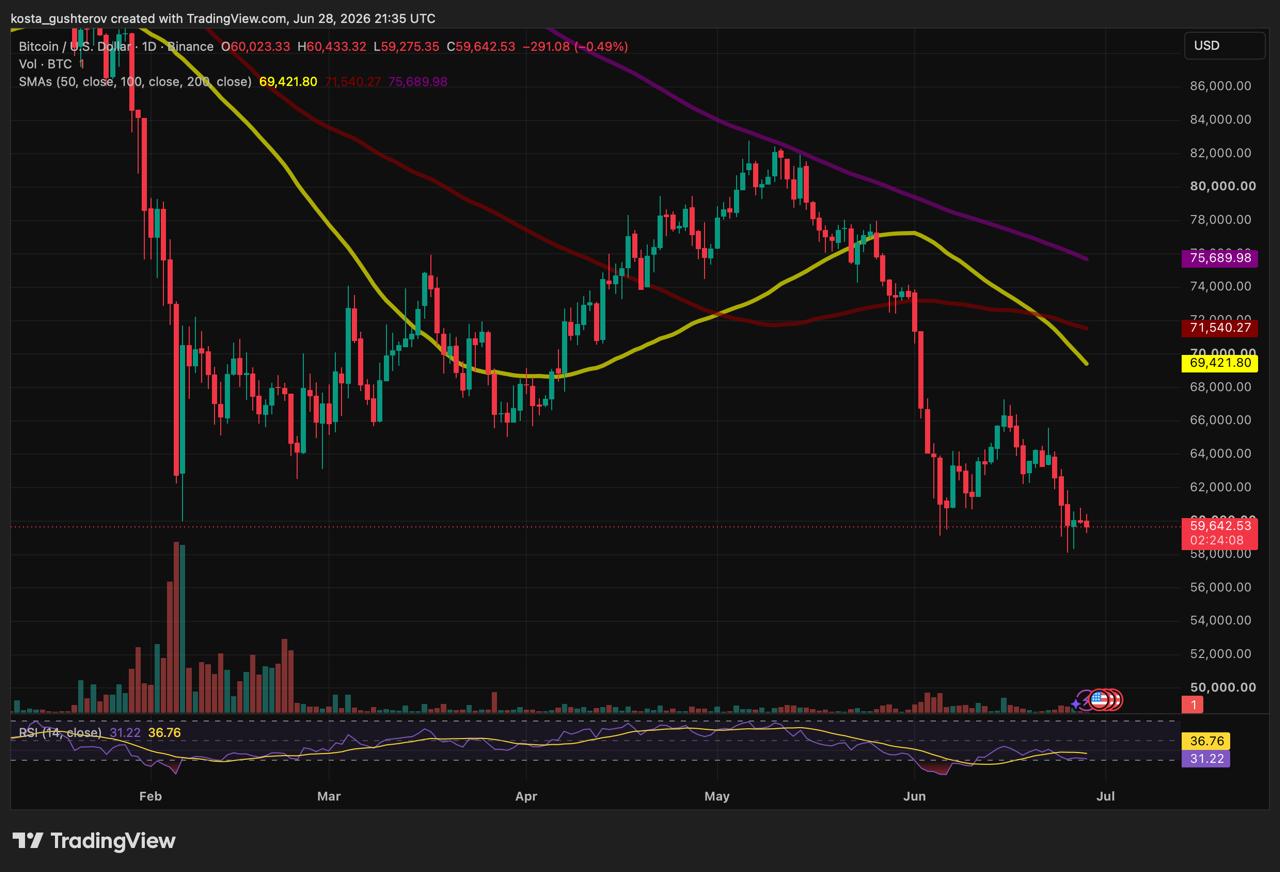
BTC trades near $59,640, back at its February levels after erasing five months of gains. 550,000 BTC flowed into Binance and OKX deposit addresses near $60K. That inflow scale was last seen during the 2022-2023 bear market. Whale signals are split: accumulation continues even as some route coins to exchanges.The chart makes one thing unambiguous: the current price matches the February lows. Bitcoin has given back roughly five months of action, everything gained from February through the April-May range is gone, and price is back where that whole sequence started. The structure overhead is firmly bearish.
 Source: TradingView
All three moving averages sit above price and are declining: the 50-day at $69,421, the 100-day at $71,540, and the 200-day at $75,689, leaving BTC roughly $10,000 to $16,000 below them. The averages are fanning out rather than compressing, with the 50-day having crossed below both longer ones and accelerating away, a textbook bearish configuration with no sign of flattening yet.
RSI at 31.22, with the signal line above it at 36.76, is approaching the conventional oversold threshold but hasn’t reached it, and momentum is still falling. RSI was in this general zone in February before the recovery, which is the one structural parallel, but a low RSI can go lower, and with the moving averages this bearish, an oversold reading alone isn’t a thesis. The recent move is a near-vertical drop from around $67,000 through $60,000 on elevated volume, which points to conviction in the selling rather than a quiet drift, and no consolidation structure has formed yet.
And still February was moving in a different context. Then, price was coming off a decline from October 2025 all-time highs and found a floor near $59,000-$60,000 before recovering. Now it’s arriving at the same level from above, after a multi-month range. The price match is real, but whether the level holds depends on demand here and now, not on what happened in February.
The Inflow Event: 550,000 BTC Staged
The on-chain data is where the pressure shows up most clearly. As BTC tested $60,000, roughly 220,000 BTC flowed into Binance deposit addresses and 330,000 into OKX, 550,000 BTC in total. On the CryptoQuant chart, that inflow spike is the largest bar on the entire 2022-2026 dataset, sitting level with the 2022-2023 bear-market peaks. Against yearly averages of about 60,000 BTC for Binance and 95,000 for OKX, the event registered at roughly 3.5x normal on both exchanges at once.
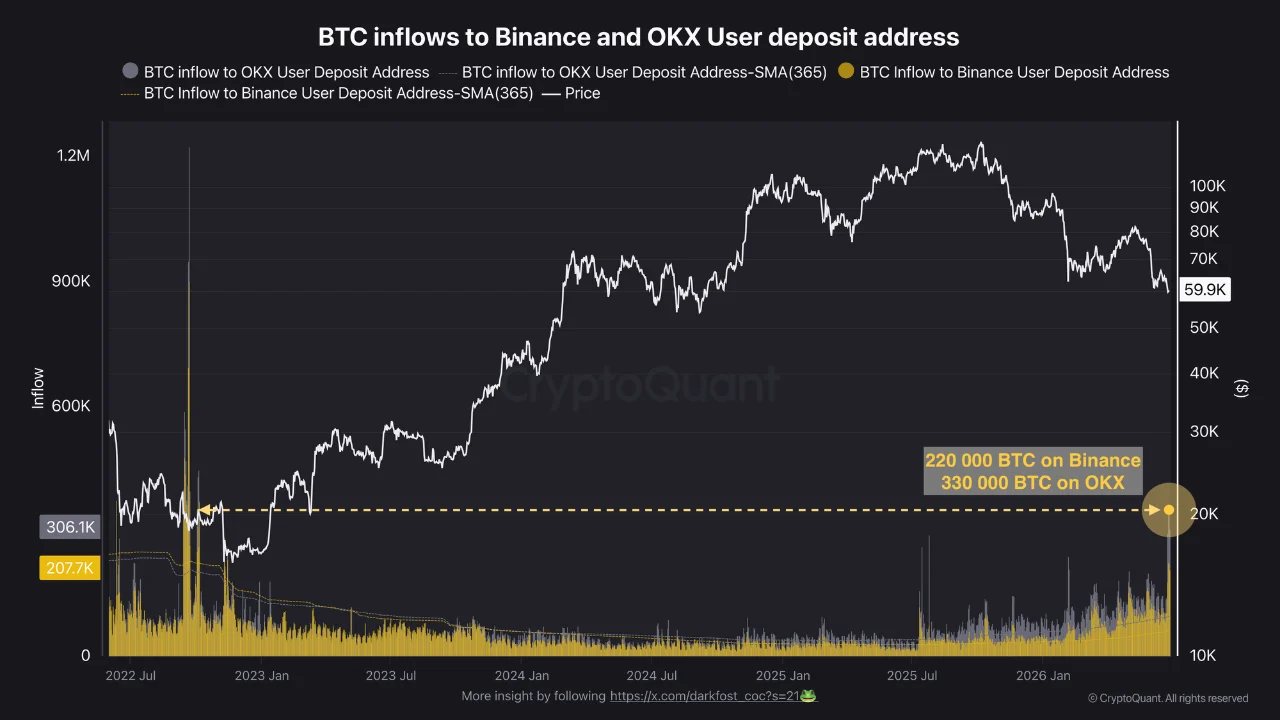
What that means requires precision. These are transfers to deposit addresses linked to exchange hot wallets, not confirmed sales. The usual path for someone intending to sell runs from self-custody to a deposit address to the exchange’s operational wallet, and only then to an order. So this data captures intent-to-sell positioning, pressure building, not pressure already released. The scale is what makes it notable: you have to go back to the 2022-2023 bear market, when BTC traded between roughly $15,000 and $25,000, to find inflows this large. The same behavior is now appearing near $60,000, which makes it historically anomalous for this price range rather than simply big.
The Whale Picture Is Split, and That’s the Point
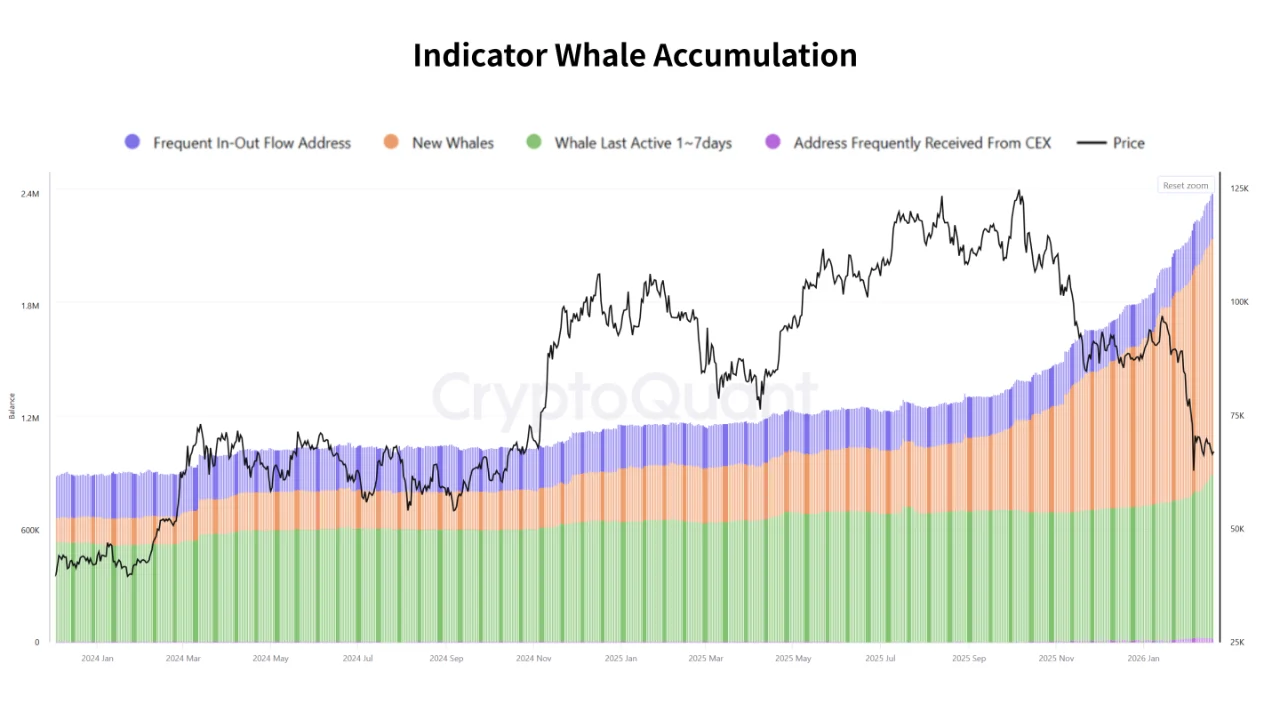
Two whale signals are running in opposite directions at the same time, and the temptation is to call that a contradiction. It isn’t. The Whale Accumulation Indicator shows continued growth across whale wallet categories, new whale addresses rising and existing whales still adding, right through the decline from $125K toward $60K. Large holders have been building positions during the drawdown.
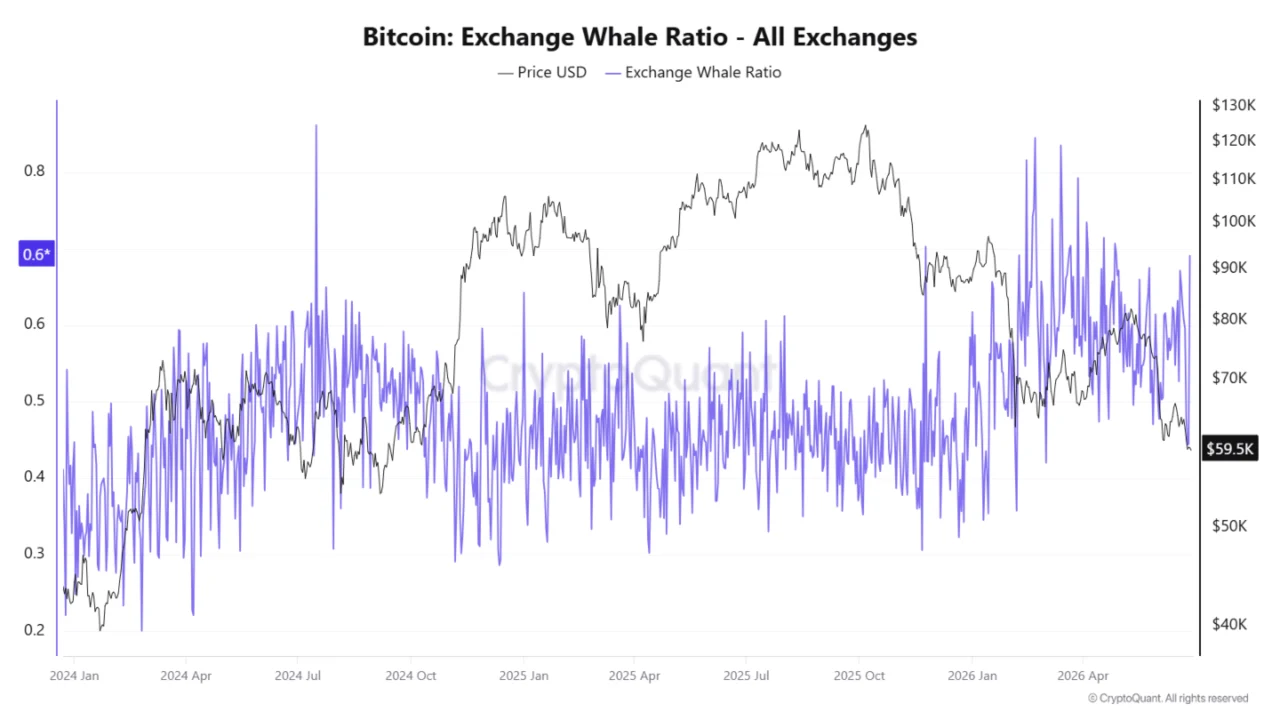
At the same time, the Exchange Whale Ratio is elevated, meaning a significant share of the BTC flowing onto exchanges right now is coming from large holders, and historically an elevated reading there correlates with near-term selling pressure. Both can be true at once: a whale can grow its net balance while routing some holdings to exchanges for liquidity, rebalancing, or partial profit-taking. The aggregate position grows even as a portion is staged for sale. So the split isn’t a flaw in the data, it’s the actual state of the market, accumulation and sell-staging happening side by side.
The Behavioral Layer
The $60,000 break triggered a reactive response, concentrated among retail and mid-tier holders on Binance and OKX. Months of sideways action since February had made participants hypersensitive to the edges of the range, so when price broke below $60K, the deposit-address inflows spiked, a large number of holders staging BTC for sale at the same moment. That’s fear-driven behavior, a cohort caught between FOMO and fear of losses, neither fully committed to holding nor positioned to sell, forced into a reaction by the break.
What the Data Does and Doesn’t Say
It’s worth being exact about the limits. The inflow data does not confirm those 550,000 BTC were sold, it shows them staged. It doesn’t tell you whether the whales accumulating are the same actors routing coins to exchanges. And none of it confirms whether $60,000 holds or fails. The inflows are a pressure gauge, not a directional signal on their own.
What the combined picture does show is a market under sustained selling pressure, testing a psychologically significant level, with a bearish structure overhead and an unusually large amount of supply staged on exchanges, while large holders keep accumulating underneath. The elevated Exchange Whale Ratio suggests near-term volatility is likely regardless of which way it resolves. The signals worth watching from here are whether open interest rebuilds and how ETF flows behave alongside the whale data, those would show whether the staged supply gets sold or withdrawn, and whether demand steps in at this level the way it did in February, or doesn’t. The level is being tested in real time. The data sets the stakes without calling the outcome.
The post Bitcoin Holds Near $60,000 as Deposit Inflows Reach 2022 Levels appeared first on Coindoo.


 Bengali (Bangladesh) ·
  English (United States) ·