 1 month ago
15
1 month ago
15 
Key Takeaways
XRP at $1.3523, $0.0049 below the 50 SMA at $1.3572. Open interest at $843M, down 18.5% from $1.035B March peak. Taker buy/sell ratio at 0.974. Whale Binance withdrawals at 1.08B XRP. Transaction count at 1.7M, down from 4.85M April 7 spike that didn’t move price.XRP is trading at $1.3523 on April 15, down 1.35% on the day and $0.0049 below the 50 SMA at $1.3572. That is the thinnest margin between price and its moving average of the past two weeks.
According to TradingVie’s 1h chart, the RSI at 43.41 with the signal line at 47.25 has both indicators below 50 and the signal line leading lower, momentum has rolled from the April 13 spike without finding a new direction. The $1.3270 horizontal support is the floor below current price.
The 50 SMA is the ceiling above it. XRP is compressing between two levels separated by less than couple of cents.

What Open Interest Shows
According to CryptoQuant data, XRP open interest across all exchanges peaked at $1.035 billion on March 16, the same session price reached $1.55. Since then both have declined together. Current open interest sits at $843.16M, down 18.5% from the peak, moving in the same direction as price rather than against it.

That correlation matters. When open interest rises as price falls, shorts are building, a potential squeeze setup. When open interest falls as price falls, longs are exiting, orderly deleveraging. XRP’s open interest has been doing the latter since March 16. The brief recovery to $875M on April 13 coincided with the broader market rally and has since reversed to $843M. There is no short squeeze fuel accumulating in this data. There is a market reducing its leveraged exposure as the rally loses momentum.
The Taker Ratio
The taker buy/sell ratio across all exchanges sits at 0.974, below the 1.0 parity line that separates buyer-dominated flow from seller-dominated flow. The pattern since March 25 tells the fuller story. The ratio has oscillated between 0.87 and 1.13, spending more sessions below 1.0 than above it. Green spikes above parity, April 13 reached 1.075, have coincided with price bounces but have not held. Each spike has reversed within 24–48 hours.

A taker ratio below 1.0 does not mean distribution. It means the marginal participant in the market is a seller rather than a buyer. At 0.974 the imbalance is not severe, it is $0.026 worth of selling pressure per dollar of buying pressure. But it has been persistent, and persistence without resolution in either direction is the definition of the compression XRP is currently in.
The Network Disconnect
XRP Ledger transaction count sits at 1.7 million, down from a peak of 4.9 million on March 17 and a secondary spike of 4.85 million on April 7. The April 7 transaction spike is the most analytically interesting data point in this article. Network activity nearly matched its March peak while price sat at $1.35, $0.20 below where it was when the March spike occurred. Transactions and price had decoupled.
![]()
What that decoupling shows is that XRP Ledger usage is not price-dependent in the short term. The network processed nearly 5 million transactions at $1.35 that it also processed at $1.55. That is either a sign of organic utility growing independently of speculative price action, or a sign that high transaction volume is no longer a reliable leading indicator for price in the way it appeared to be in March. Current transaction count at 1.7M returning toward the March lows suggests neither interpretation has resolved.
Whale Dormancy
XRP whale withdrawals from Binance have fallen to 1.08 billion XRP on a 30-day rolling basis, the lowest level since 2021. The historical chart places that reading in context: the 2022–2023 period saw whale withdrawals peak as price peaked, and withdrawal activity has been declining alongside price since the 2024–2025 cycle highs.
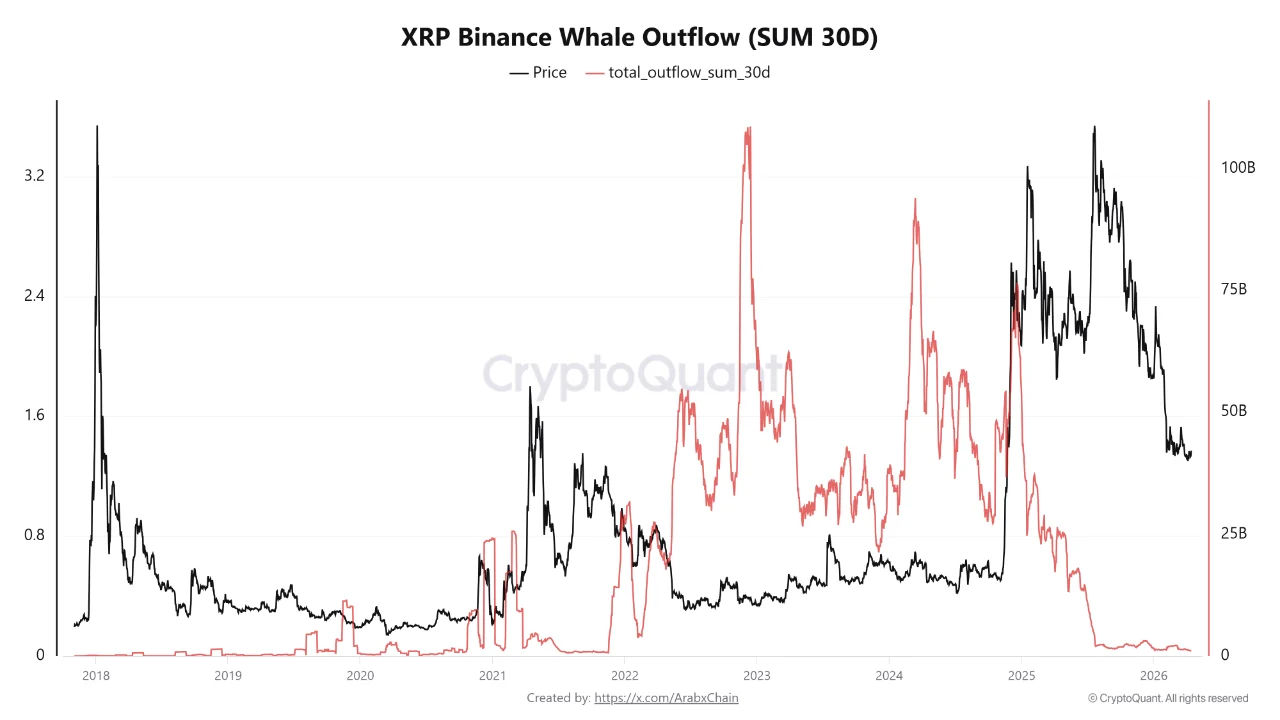
Two readings of the current low are possible and the data does not distinguish between them. The first is reduced institutional activity, whales have stepped back from active redistribution and the market is operating with less large-scale flow than at any point in four years. The second is pre-move dormancy, whale withdrawal periods at multi-year lows have historically preceded larger directional moves as major holders wait for clarity before repositioning. Both readings produce the same observable outcome. Only the subsequent price action reveals which one was correct.
What the Combined Picture Shows
Four datasets, open interest, taker ratio, transaction count, whale withdrawals, are describing the same condition from four different angles. Open interest is declining, removing leveraged fuel in either direction. The taker ratio is marginally negative, reflecting persistent but not aggressive selling. Transaction count is low, suggesting network activity has not yet returned to the levels that preceded the last price move. Whale withdrawals are at a four-year low, indicating major holders are not actively redistributing.
The word for all four of these readings together is dormant. Not bearish. Not bullish. Dormant. XRP at $1.3523, $0.005 below its 50 SMA, with RSI below 50 and momentum neutral, is a market that has compressed to the point where the next directional input will find very little resistance in either direction. Compressed markets don’t stay compressed. The data describes the coil. The trigger will come from somewhere the on-chain data cannot see like developments around Iran-US war, which is waiting for its second round of ceasefire talks.
When that trigger arrives, the sequence of which signal moves first will tell the story. Open interest is the fastest, a surge in OI with price is the first confirmation that new leveraged conviction has entered. The taker ratio confirms it within hours. Transaction count follows as network activity responds to price movement. Whale withdrawals are last, the slowest signal, the most meaningful, and the one that has not moved since 2021. If whales start withdrawing at scale again, the dormancy phase is over and the next cycle leg has begun.
The information provided in this article is for educational purposes only and does not constitute financial, investment, or trading advice. Coindoo.com does not endorse or recommend any specific investment strategy or cryptocurrency. Always conduct your own research and consult with a licensed financial advisor before making any investment decisions.
The post XRP Sits $0.005 Below Its 50 SMA: On-Chain Signals Describe a Market Waiting to Move appeared first on Coindoo.


 Bengali (Bangladesh) ·
  English (United States) ·