
 3 hours ago
4
3 hours ago
4 
Key Takeaways
Binance XRP open interest fell to 397 million XRP, a three-month low. Lower recovery highs at $1.17, $1.155, and $1.10 cap each bounce. The $1.03 to $1.05 base has absorbed every selloff since late June. Daily RSI at 44.4 sits below neutral, above its signal line.Falling Open Interest Changes What This Range Means
Open interest measures the total number of futures contracts that remain open at any moment. When it falls, traders are closing positions or declining to open new ones. When it falls while price stays flat, as it is doing now, the market is deleveraging without dumping.
Analytics firm Arab Chain wrote on CryptoQuant that the decline points to “a slowdown in activity within the derivatives market.” The firm noted that falling open interest alongside soft prices often reflects weaker risk appetite and an outflow of liquidity from futures, leaving leverage lower than in previous periods.
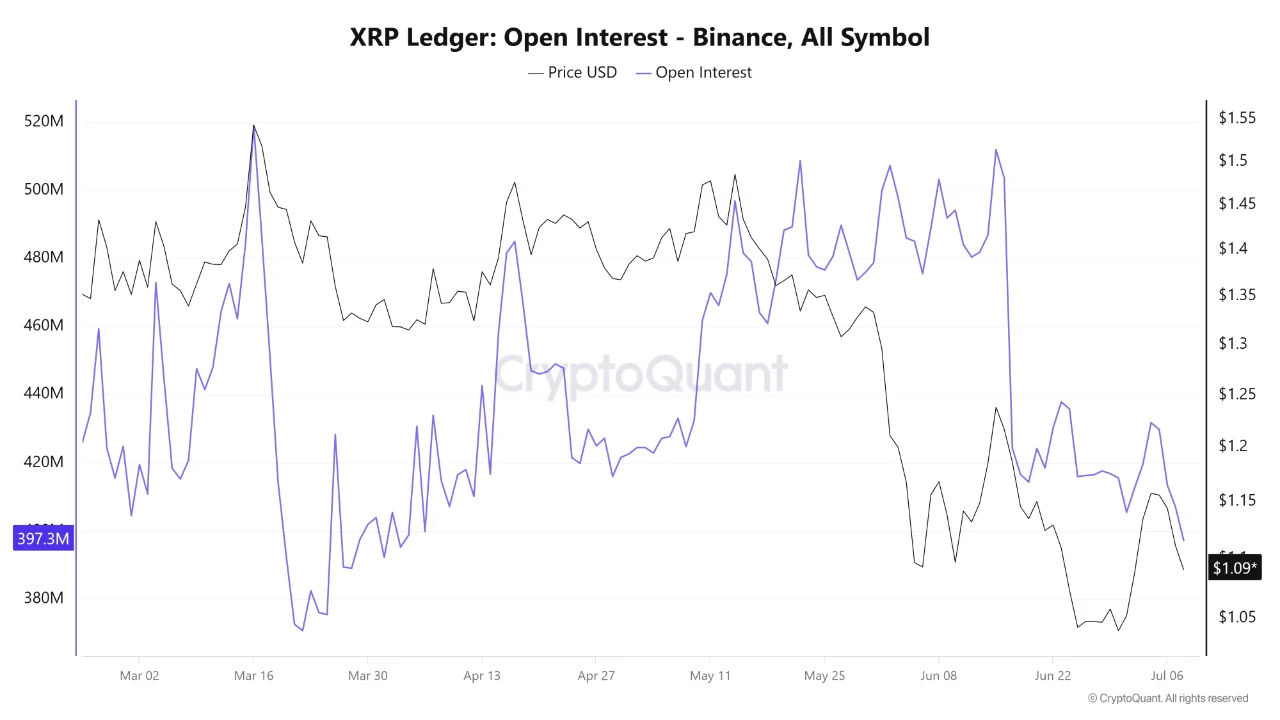 XRP Ledger open interest trends on Binance compared to XRP price movements.
The market consensus treats shrinking open interest as a bearish signal. The technical reality suggests something more neutral and arguably more constructive: the $1.03 to $1.05 base is being defended by spot buyers, not by leveraged longs. A support level held by spot demand tends to be sturdier than one propped up by futures positioning, because there are no crowded longs to liquidate if price dips into it. The same dynamic cuts both ways, though. With leverage this thin, there is also no fuel for a fast short squeeze. Whatever move comes out of this range may have to be built the slow way.
The Compression on the Chart
The daily chart shows XRP working through a sequence of lower recovery highs since the July 4 bounce peaked near $1.17. That attempt stalled almost exactly at the 50-day simple moving average, currently at $1.1747, which is the average closing price of the last 50 days and the nearest overhead barrier that matters. The next bounce topped near $1.155 on July 5 and 6, and the most recent one faded from the $1.10 area. Sellers are stepping in earlier each time.
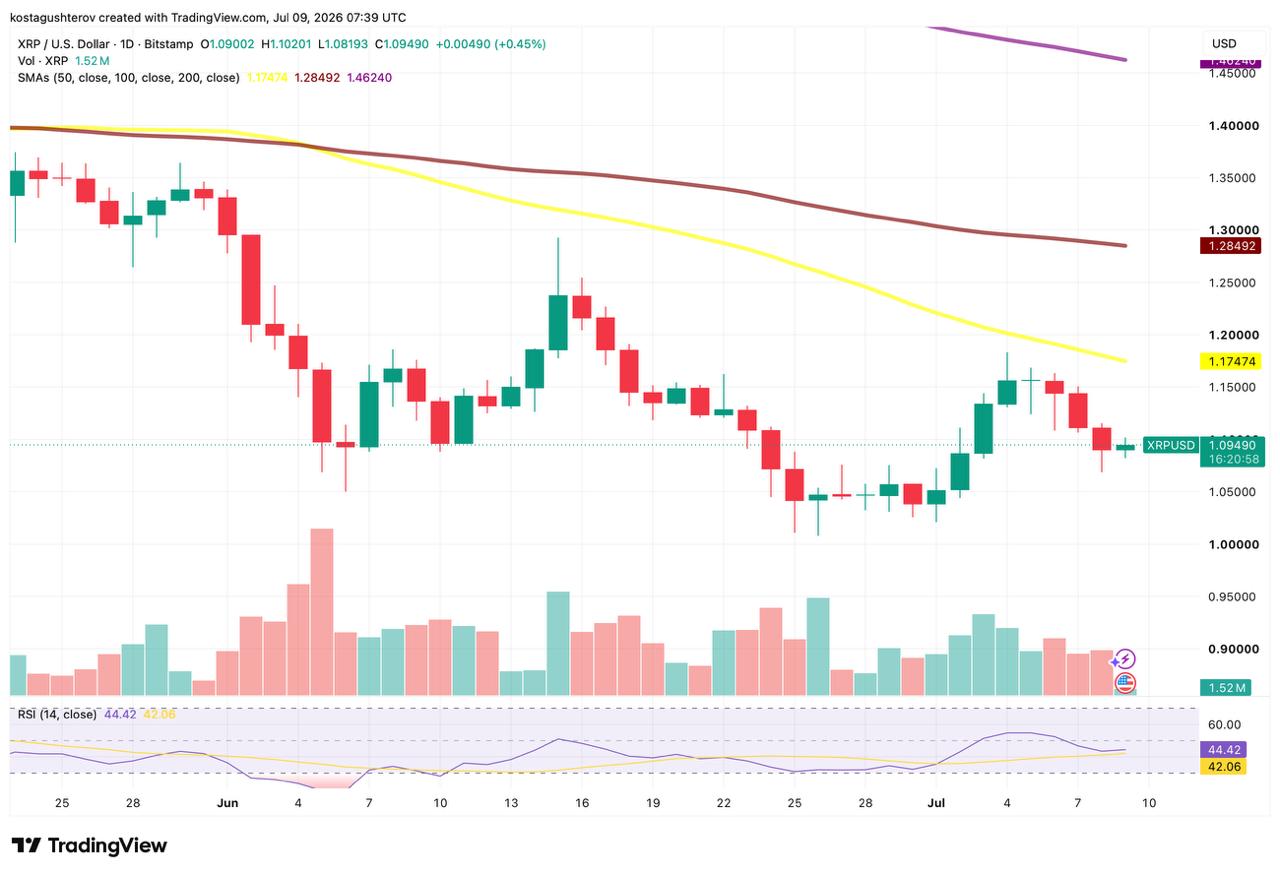 Daily technical chart for XRP/USD, highlighting current price action and indicators.
Below the price, the moving average stack tells the larger story. The 50-day sits at $1.1747, the 100-day at $1.2849, and the 200-day at $1.4624, all three sloping downward and stacked in bearish order above the market. XRP has not traded above any of them during this entire June to July window. Momentum matches the picture: the daily RSI, a gauge of recent buying and selling pressure that runs from 0 to 100, reads 44.4. That is below the neutral 50 line but holding just above its own signal average at 42.1, which is the profile of a market drifting rather than trending.
The support side looks more encouraging for bulls. The $1.03 to $1.05 zone absorbed the entire late-June selloff, with daily wicks to roughly $1.03 getting bought each time. Price has closed above that base for over two weeks. As long as it continues to do so, the larger recovery structures traders are watching, including the falling wedge interpretation of the June decline, remain potential setups. None of them is a confirmed breakout yet.

The Levels That Could Decide the Next Move
The near-term test is the lower-high sequence. XRP needs a daily close above the $1.15 to $1.17 supply zone, where the last two rejections and the 50-day average converge, to break the compression in the bulls’ favor. The 100-day average near $1.28 is the next swing hurdle, and the $1.40 to $1.46 zone under the 200-day average is where the broader downtrend would actually start to bend.
The downside line is sharper. A daily close below $1.005 invalidates the base, and $0.90 and then $0.80 come back into focus. That is also the counter-argument to the patient-accumulation read: compression resolves in both directions, and lower highs into thin derivatives participation prove nothing yet. Open interest rebuilding while price pushes above $1.10 would signal real liquidity behind a move. Open interest bleeding while the lower highs continue means the base gets tested again.
For now, XRP is in a waiting phase. The base is holding, the leverage is gone, and the chart has not yet chosen a direction.
The information provided in this article is for educational and informational purposes only and should not be construed as financial advice.
The post XRP Chart Update: Compression Building Near Key Support appeared first on Coindoo.





 Bengali (Bangladesh) ·
  English (United States) ·