 2 hours ago
1
2 hours ago
1 
Key Takeaways
Stablecoin exchange inflows sit at an 18-month low, down 56% from the mid-2025 rally. USDC and USDT supply has been contracting since November 2025, a demand gauge turning negative. Three independent methods converge on the same floor: $58,000-$60,000. BTC trades at $62,794, bouncing off its 50-month average at $59,878.Four separate on-chain lenses all describe the same market from different angles, and they agree on the structure while disagreeing only on how deep it goes: this is a liquidity drought, not a conviction collapse.
The Fuel Gauge Is Near Empty
Start with the clearest signal. According to CryptoQuant analyst Zakariya Sharif, mean stablecoin inflows across all exchanges sit at 21,557, down 56.25% and the lowest in 18 months. During the mid-2025 rally, those inflows regularly spiked between 100,000 and 280,000.
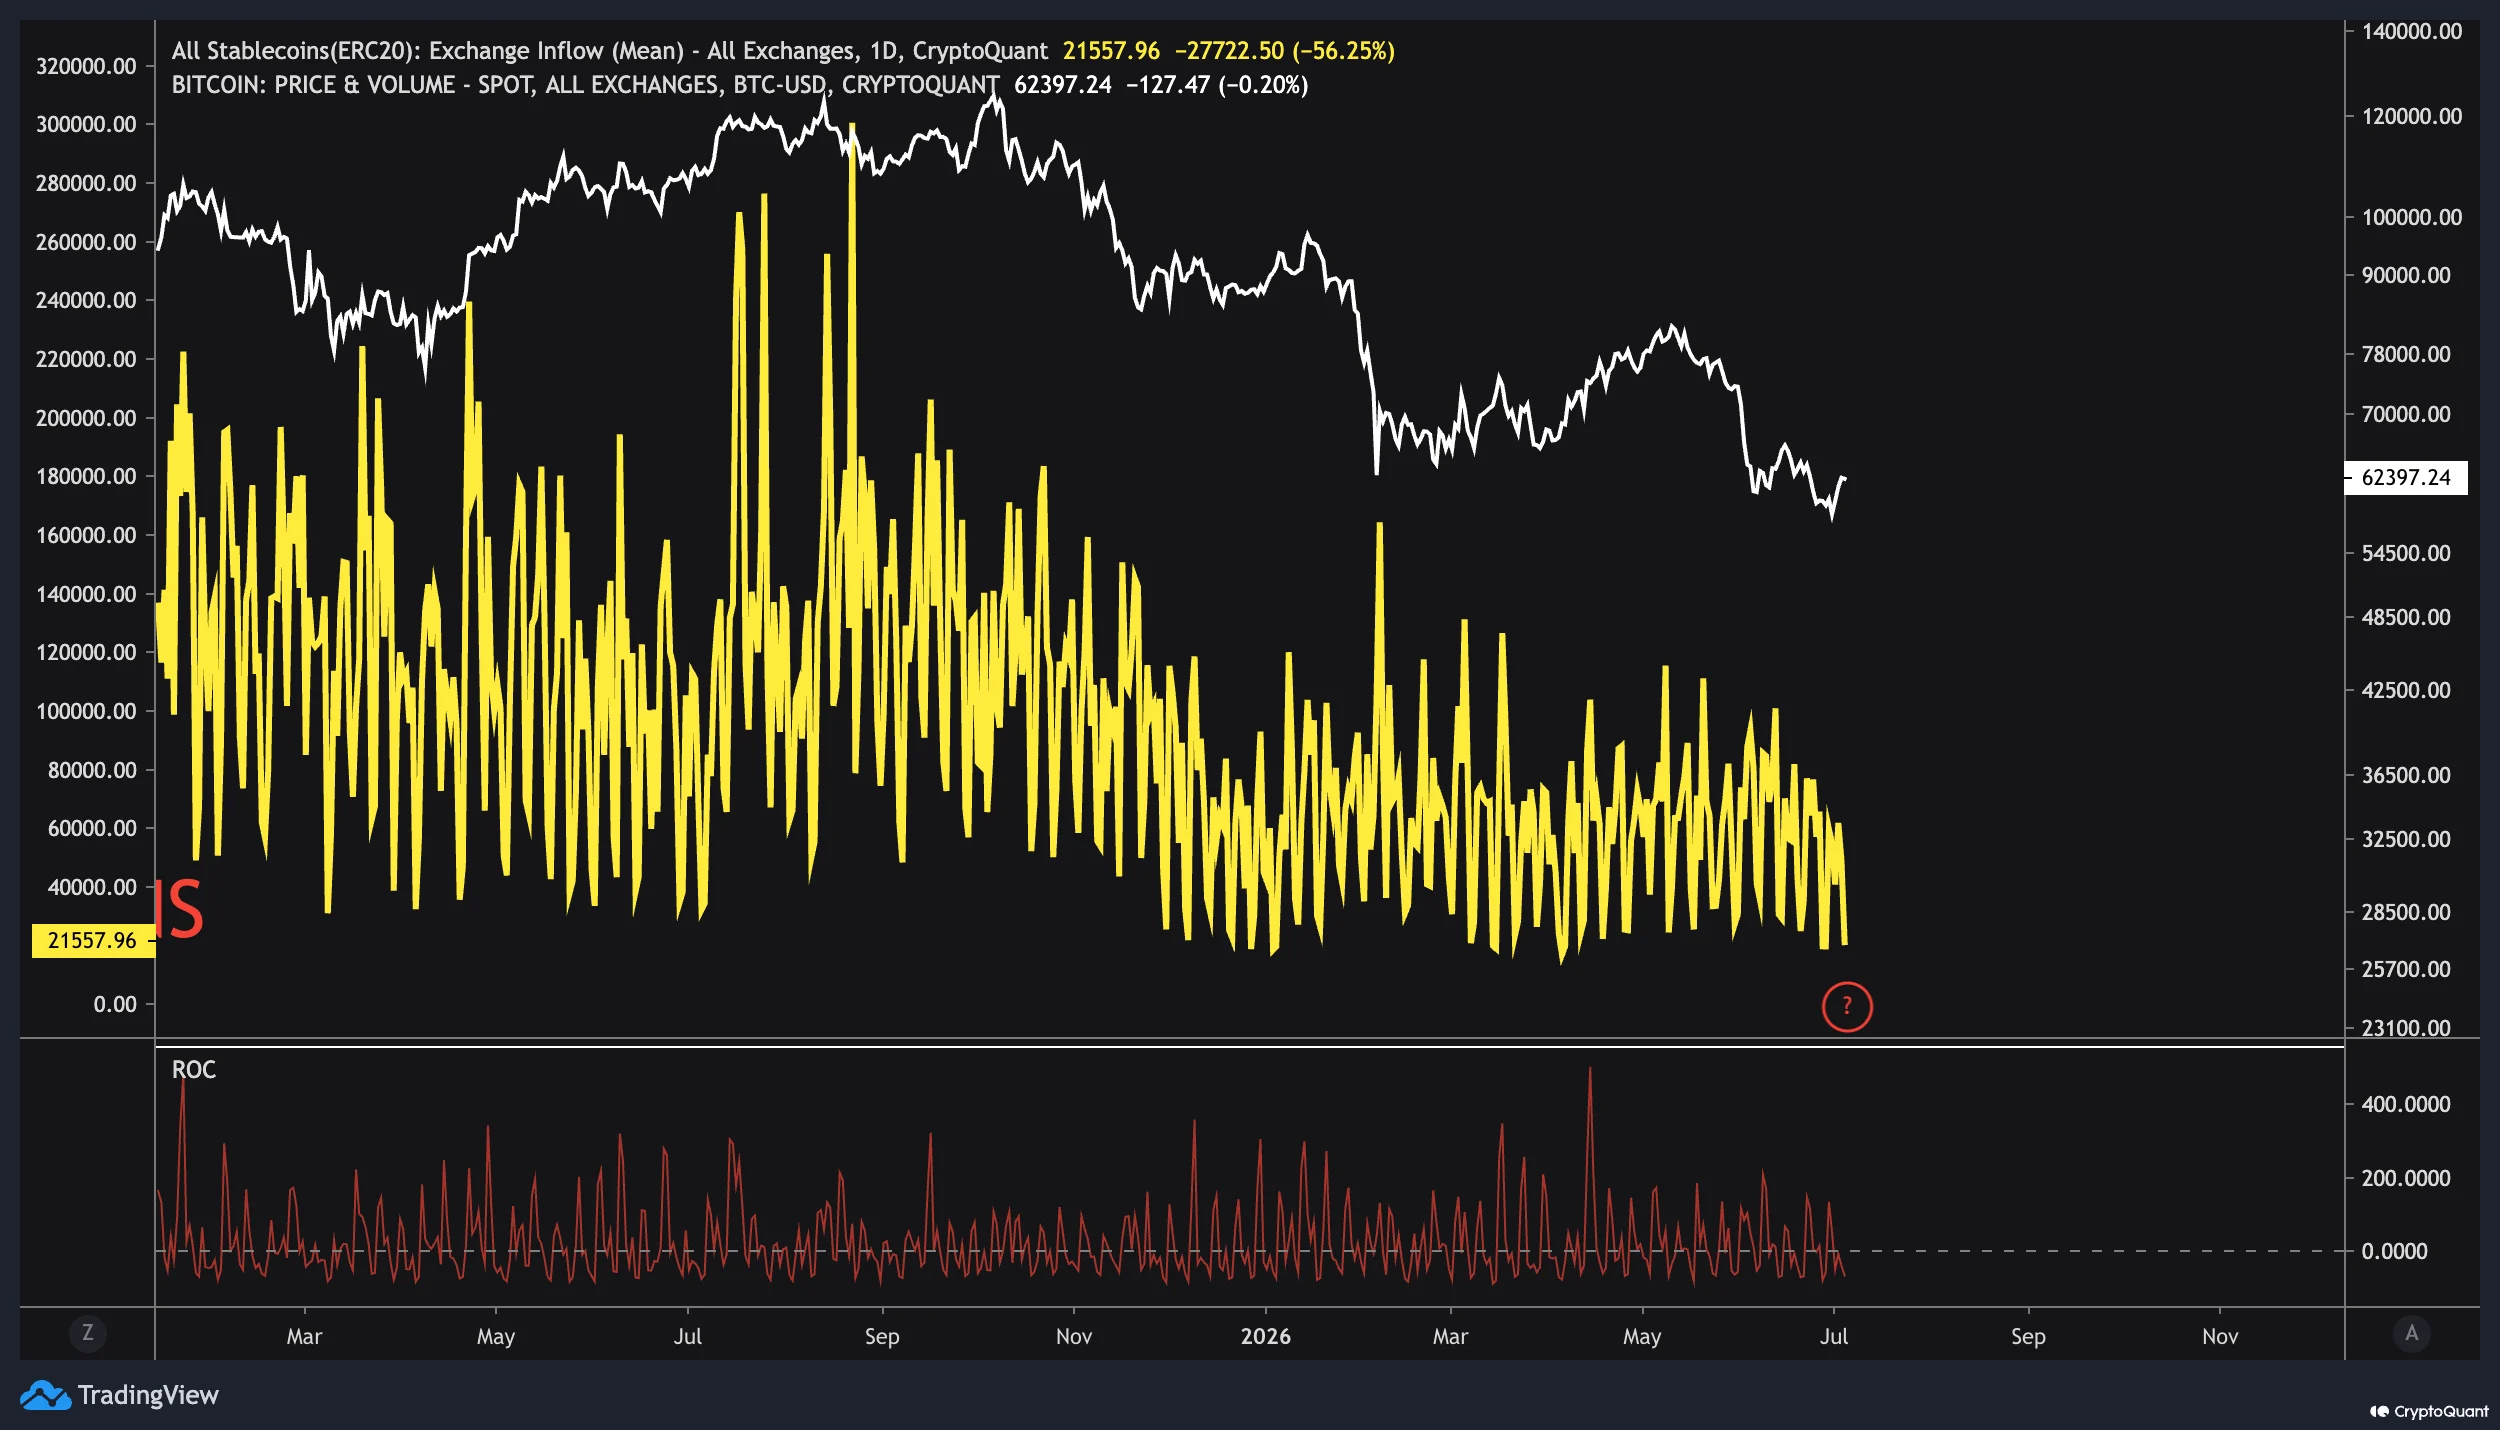 ERC20 stablecoin exchange inflow and Bitcoin price correlation.
One isolated spike in May 2026 failed to reverse the trend, and flows have flatlined since. Sharif’s framework is specific: inflows staying below 30,000 for two more weeks points to a retest of $58,000-$60,000, while a sustained recovery above 80,000-100,000 would be the first genuine sign buyers are returning.
The supply side of stablecoins tells the same story. CryptoQuant’s Darkfost notes USDC’s market cap is down 3.6% and USDT down 2% over 30 days, a contraction running since November 2025.
 30-day market cap growth of major stablecoins versus Bitcoin price.
The mechanism is what makes this meaningful: issuers mint new tokens when demand rises and burn surplus when it weakens, so stablecoin supply is itself a demand gauge. A net burn means more capital has left crypto than entered. Inflows at 18-month lows and stablecoin supply shrinking are the same fact measured twice.
Where the Money Went
This is where a growing number of prominent voices offer an explanation, and a reason the drought may not be permanent. Several major figures argue the liquidity didn’t vanish, it rotated into AI. Raoul Pal, the Real Vision CEO and former Goldman Sachs executive, frames the crypto weakness as the product of negative excess liquidity that pulled capital into AI and semiconductor sectors, a condition he now says is beginning to reverse as broader liquidity measures turn positive.
Arthur Hayes has put numbers on it, estimating that hyperscalers and AI firms issued roughly $1.5 trillion in debt between late 2022 and mid-2026, almost exactly matching the rise in M2 money supply over the same period, leading him to argue “AI sucked up all created dollars.” Tom Lee and CZ have pointed to the same rotation pattern, US semiconductor ETFs pulled in more than $20 billion since April while Bitcoin and gold ETFs saw outflows, and the shared thesis among them is that this capital tends to rotate back toward crypto once liquidity conditions ease and crypto reclaims performance leadership. It’s a view worth weighing as the optimistic counterpoint, though it remains a thesis about what could happen, not a confirmed turn.
That framing points to a deeper structural shift underway, one Michael Saylor has articulated more directly than most. Saylor argues that “Bitcoin evolves by not changing,” meaning its next phase will come not from frequent protocol upgrades but from being woven more deeply into global finance.
— Michael Saylor (@saylor) July 5, 2026
In his view, the coming decade will be driven by capital flows rather than miner issuance, with demand increasingly sourced from ETFs, corporate treasuries, sovereign reserves, bank credit, derivatives, insurance, collateral markets, structured credit, and global savings. “The halving tightens supply. Capital flows set the growth trajectory,” as he puts it, reflecting his conviction that institutional adoption, not the protocol itself, is the engine of Bitcoin’s long-term growth. It’s a useful lens for the current moment: if capital flows are what ultimately move Bitcoin, then the stablecoin drought this article describes is precisely a capital-flow problem, and the case for a recovery rests on those flows turning, exactly as the AI-rotation thesis suggests they could.
How Deep Is the Bottom?
The depth gauges agree the market is in a bottom-formation zone, but not yet at historical extremes. Darkfost, using a chart by Joao Wedson, points to the True Market Mean, the average price of active Bitcoin excluding long-dormant coins, sitting near $76,700. That level acted as resistance in May, when holders exited at break-even rather than keep holding.
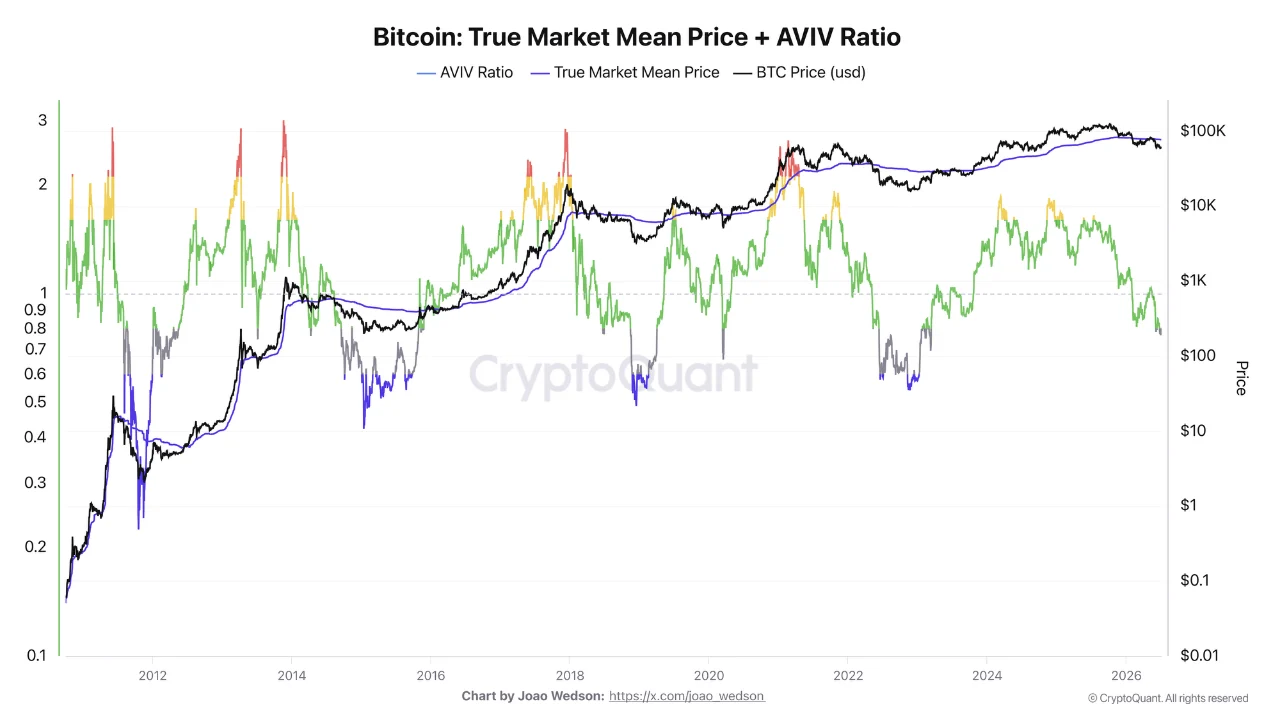 Bitcoin True Market Mean Price and AVIV Ratio analysis.
The related AVIV ratio sits around 0.8, meaning the active cohort holds an average 20% loss. Prior bear-market bottoms printed 0.5-0.6, or 40-50% losses, so this is significant but not yet capitulation-grade. Darkfost’s own hedge is worth keeping: ETF-era adoption may mean full historical devaluation isn’t required, though nothing yet contradicts the cyclical pattern.
CryptoQuant’s Yonsei adds another measure. Just 51.9% of circulating supply is in profit, in bear/bottom territory below 55% since June and trending down since October 2025, approaching the 44% that marked the 2022 absolute bottom. That 2022 bottom phase lasted roughly eight months; mapped onto this cycle, the phase could stretch into September or October 2026.
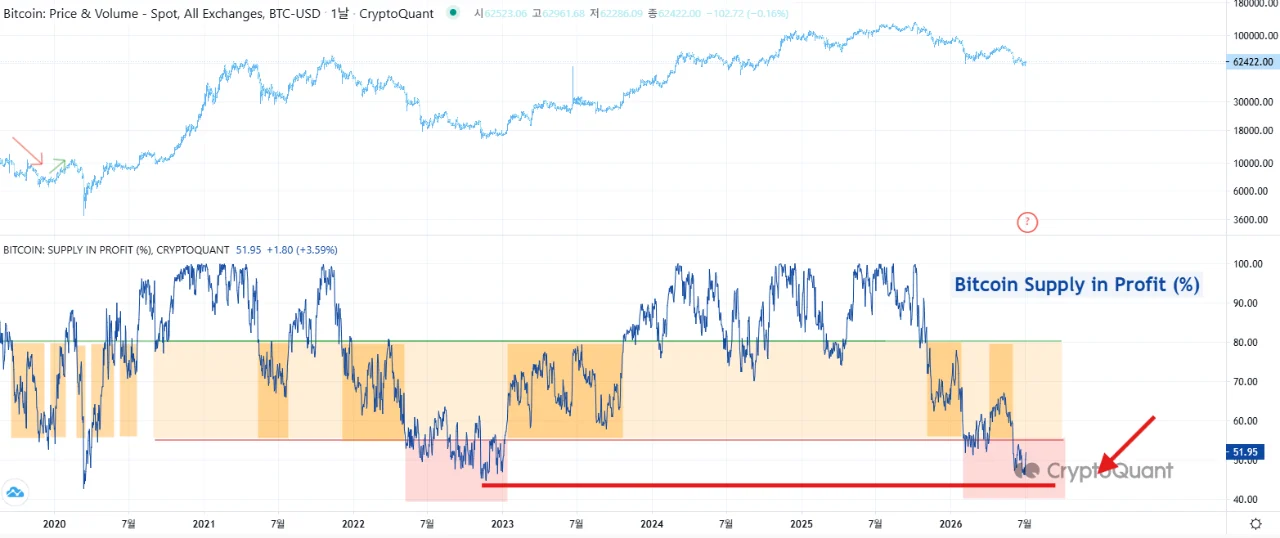 Bitcoin supply in profit percentage trends.
Every depth gauge says the same thing with different numbers: AVIV at 0.8 versus 0.5-0.6 at prior bottoms, Supply in Profit at 51.9% versus 44% in 2022, drawdown around 50% versus 60-80% in prior cycles. The 2022 template has room left. The open question is whether ETF-era adoption shortens the distance.
The Levels All Point to One Floor
Here’s the detail that could tie everything together. On the monthly chart, July’s candle is up 7.29% to $62,794 after a June low of $57,700, and it’s bouncing off a level that matters: the 50-month simple moving average at $59,878. This is the same average Bitcoin never lost during the entire 2024-2025 run. Monthly RSI at 43.14 is the weakest of the cycle, while the 100-month average at $40,488 stands as the historical bear-market floor reference.
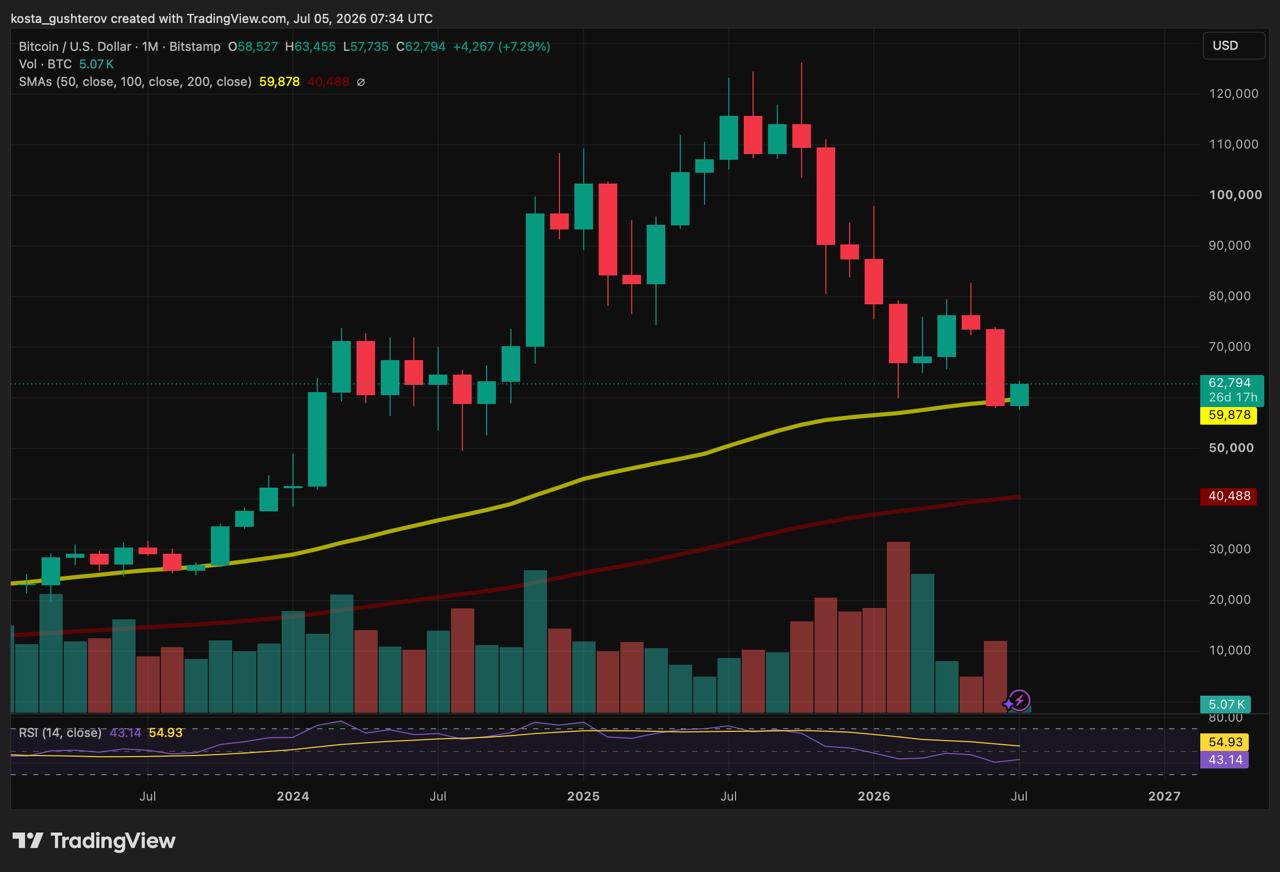 Monthly BTC/USD price chart on Bitstamp / Source: TradingView
What makes the $58,000-$60,000 zone compelling is that three completely independent methodologies land there. Sharif’s on-chain risk zone ($58,000-$60,000), the June price low ($57,700), and the 50-month SMA ($59,878) all sit in the same band. Flow analysis, price history, and long-term trend structure, three unrelated approaches, identify the same floor. Above price, the ceiling story converges too: the True Market Mean at $76,700 is where active holders break even, which functionally caps rallies until either price consolidates long enough for the cost basis to fall or demand strengthens enough to absorb those break-even sellers.
That said, this is still crypto, a market that has a long history of surprising even the most aligned models, and if there’s one thing the past cycles have taught, it’s that when every analyst and dataset agrees on a floor, the market is fully capable of slicing straight through it to levels no one was positioned for.

Three Frameworks, One Timeline
The timing estimates cluster just as tightly. Yonsei_dent’s Supply-in-Profit template points to September-October. Markus Thielen’s earlier analysis mapped a Q4 bottom. Rekt Capital’s estimate that the cycle is 71% complete implies late 2026. Three unrelated frameworks land in the same quarter, and that clustering is itself information worth stating plainly, rather than any single forecast carrying the weight.
This is also corroborated outside CryptoQuant. A CEX.IO report covered by CryptoSlate found total stablecoin supply contracted to $312 billion in Q2, the first quarterly decline since 2023, with transaction counts posting their largest drop on record. The liquidity story isn’t one analyst’s read; it’s showing up across independent datasets.
The Sequence to Watch
The value in stacking these signals is that they have an order, a sequence that could confirm a genuine turn rather than a false start:
First, stablecoin supply must stop burning. Issuance is the fuel gauge, and it has to stabilize before anything else matters. Then, exchange inflows recover above 80,000-100,000. That’s the fuel actually reaching the engine. Then, Supply in Profit reclaims 55%. The marker of the phase transition out of bottom territory. Finally, price has to take on $76,700. The structural exit test, where break-even sellers get absorbed.Right now the market sits at step zero, holding the $58,000-$60,000 floor while it waits for step one. A monthly close below the 50-month average at $59,878 before that liquidity turn arrives could invalidate the floor thesis and open the path toward the deeper historical targets. Until the dollar side of the order book refills, this is a market resting on a well-defined floor, with conviction intact and only the fuel missing.
The post Why Bitcoin Struggles to Rally: A Closer Look appeared first on Coindoo.


 Bengali (Bangladesh) ·
  English (United States) ·