 1 month ago
6
1 month ago
6 
TLDR
SOL is trading around $80–$85, a zone that triggered massive rallies in past cycles. A liquidation heatmap shows short pressure building between $84 and $87. The key level to watch is $106.24 — a break above that would signal a return of bullish momentum. Analyst Crypto Patel notes SOL is back at the same buy zone that pumped it 2,200% last cycle. A large triangle pattern on the chart could lead to a breakout toward $250–$300 if buyers hold support.Solana is trading near $80 to $85 at the time of writing, a zone that has played a key role in previous market cycles. The price dropped more than 70% from its 2025 highs before landing back in this range.
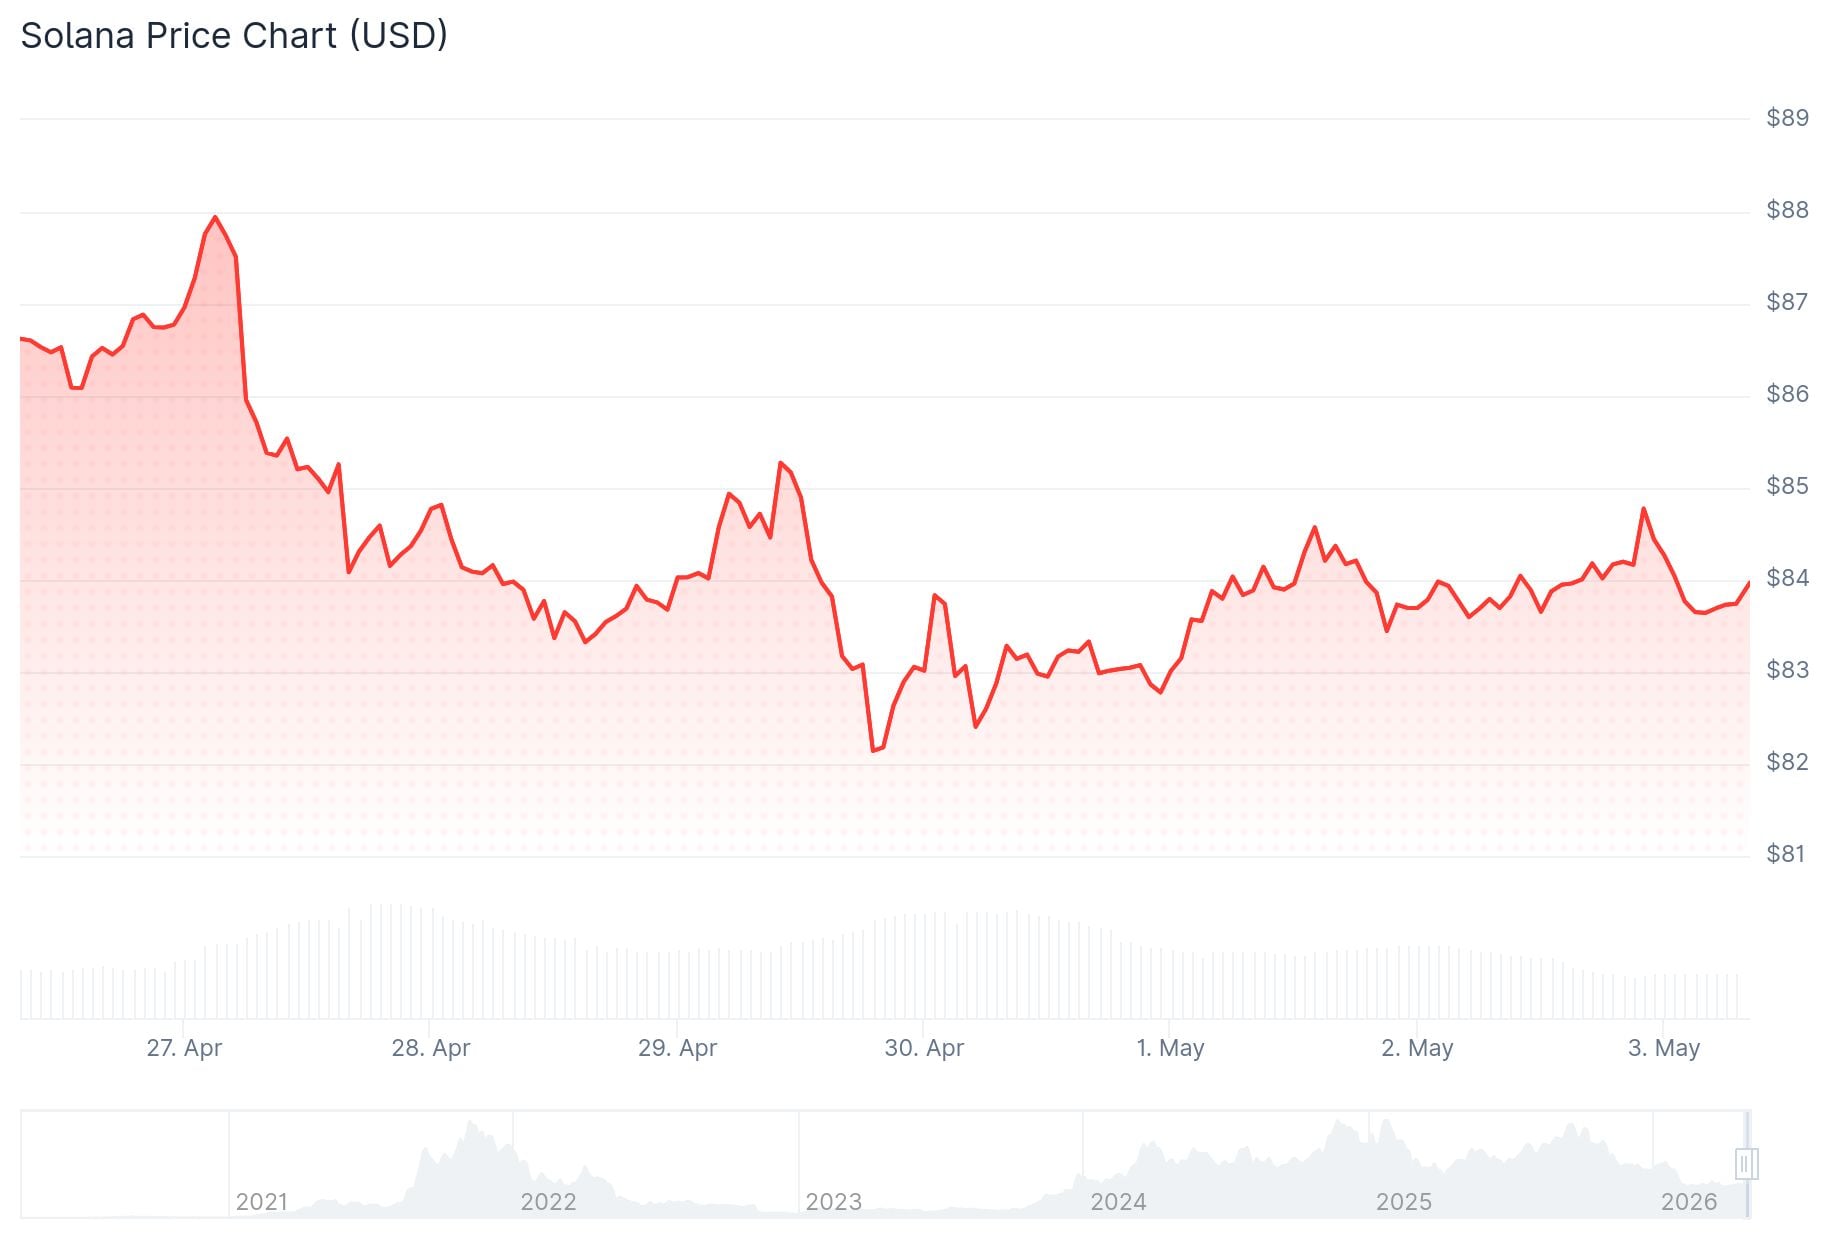 Solana (SOL) Price
This isn’t the first time SOL has been here. In 2021, the price ran from just a few dollars to over $250. After a heavy drop in 2022, it fell close to $10, rebuilt, and then pushed to new highs near $290 in the next cycle.
Crypto Patel, a widely followed analyst on X, made note of this directly. In a recent post, Patel wrote: “$SOL is back at the same buy zone that pumped it 2,200% last cycle. Will it hit $1000 in alt season?” The tweet points to a pattern that has repeated across multiple cycles, where this price range served as a launchpad for large moves higher.
$SOL Is Back At The Same Buy Zone That Pumped It 2,200% Last Cycle.
Will It Hit $1000 In Alt Season? pic.twitter.com/C1tvo3xyx9
— Crypto Patel (@CryptoPatel) May 2, 2026
Key Levels to Watch
A SOL liquidation heatmap shared by CoinAnk shows short positions building in the $84 to $87 zone. Price dipped to around $81 before rebounding toward that upper cluster. Liquidation heatmaps track where leveraged positions could be forced closed if price reaches certain levels.
Analyst Don has shared a chart showing $106.24 as the next key level SOL needs to reclaim. Until that level is cleared, the chart does not show a confirmed return of bullish momentum. Above $106, a further target sits at $260.17, though that remains well out of reach for now. If buyers fail to hold the current zone, the chart points to a possible drop back to $80 or lower.
$SOL needs to get above the $106 to enable full bull mode again.
right now it looks like $80 is on the table again, but I expect bulls to step in and defend. pic.twitter.com/YzOQ6IsWOo
— Don  (@DonWedge) April 30, 2026
Triangle Pattern Adds More Pressure
Analyst Javon Marks shared a chart showing SOL locked inside a large triangle pattern. The structure shows lower highs and higher lows forming over a long period, which typically compresses price before a larger move.
Broadening Formation present in solana:So11111111111111111111111111111111111111112!
With prices right at support of this pattern, there's potential Solana pushes right off towards the high $300 price points… pic.twitter.com/tq4fY9lcTp
— JAVON MARKS (@JavonTM1) May 1, 2026
Solana is currently sitting near the lower edge of that triangle, around $75 to $85. If buyers defend that level, the breakout targets come in around $250 to $300. A break below the mid-$60s, however, would weaken the pattern and put the $45 area into focus.
At the time of writing, SOL is still holding inside the current support zone between $80 and $90, with $106.24 remaining the next major level for bulls to reclaim.
The post Solana (SOL) Price: Back at the Buy Zone That Sparked a Massive Rally Last Cycle appeared first on CoinCentral.


 Bengali (Bangladesh) ·
  English (United States) ·