
 1 hour ago
7
1 hour ago
7 

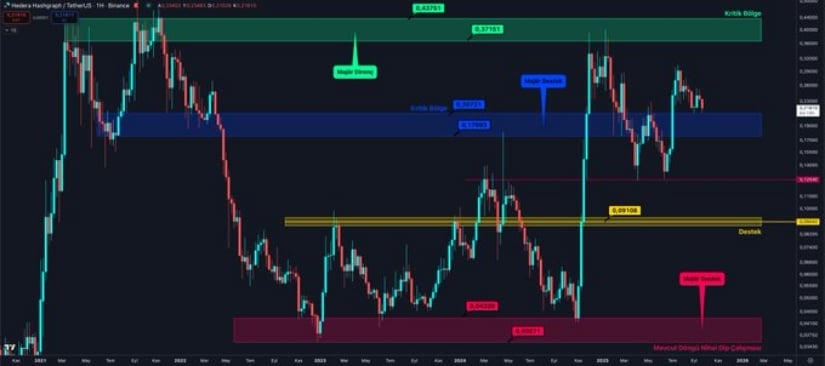
The token’s price movement within this defined range could shape its short-term trajectory, leaving market participants closely monitoring these pivotal zones.
Key Resistance and Support Zones Shape Hedera’s Outlook
According to the analysis, HBAR’s most immediate challenge lies within the $0.43751 to $0.37315 resistance range. This area has consistently capped upward momentum, making it a critical hurdle for buyers to overcome before the market can aim for higher price targets.
If this zone is successfully cleared, it could signal renewed confidence and strengthen the case for a sustained bullish move. However, repeated rejections in this region may weigh on sentiment, keeping the token constrained within its broader trading range.
Source: X
On the downside, support levels remain equally important for the coin’s stability. The broader support zone between $0.03430 and $0.00957 represents significant buyer interest, historically providing the foundation for recoveries.
Within this framework, the intermediate support at $0.09108 stands out as a key pivot for near-term trading activity. Holding above this level could offer a buffer against volatility, while a breakdown might open the door to retests of deeper support zones.
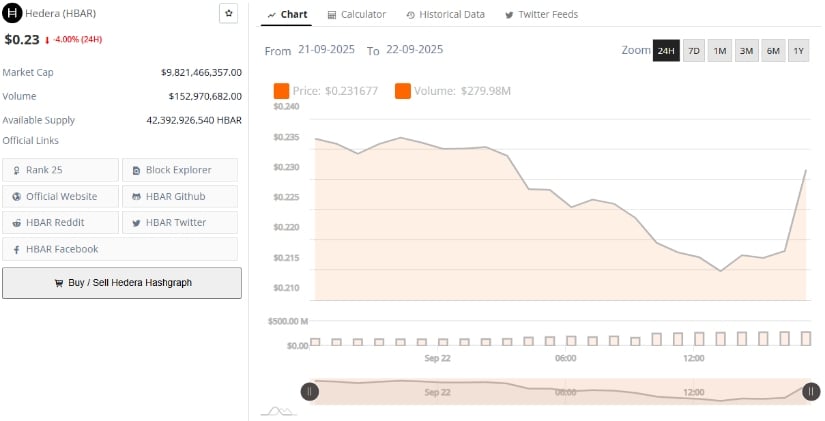
Market Data Reflects Ongoing Price Weakness
Additionally, BraveNe Coin data shows Hedera trading at $0.23 after recording a 4.00% decline over the last 24 hours.
The token’s market capitalization stands at $9.82 billion, placing it firmly within the top 25 digital assets. Daily trading volume reached $152.97 million, reflecting active participation despite the downturn. The price has moved within the $0.21 to $0.24 range in recent sessions, pointing to heightened volatility around current levels.
Source: BraveNewCoin
The circulating supply of the asset is reported at 42.39 billion tokens, providing context for its valuation in the broader crypto market. While the decline highlights short-term pressure, the asset’s established liquidity and market ranking continue to draw attention.
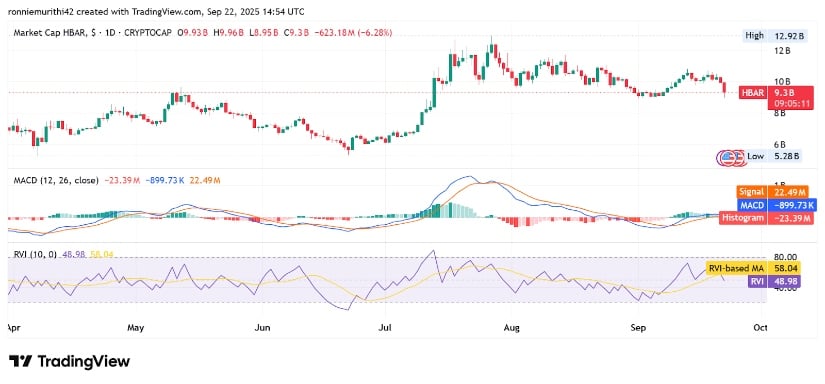
Technical Indicators Signal Mounting Bearish Pressure
At the time of writing, HBAR’s market capitalization is $9.3 billion, reflecting a 6.33% daily decline. On the daily chart, the token failed to maintain levels above the $10 billion threshold and is now trading closer to local support zones after a sharp pullback. This move comes on the heels of a prolonged sideways trend, pointing to increased selling activity and fading market sentiment.
Source: TradingView
Momentum indicators reinforce this bearish backdrop. The MACD histogram has slipped to -23.68 million, with the MACD line positioned beneath both its signal line and the zero line, highlighting intensified downward momentum.
In addition, the Relative Vigor Index (RVI) stands at 48.95, remaining under its average and signaling further downside pressure without yet reaching oversold conditions. The data suggests that, without renewed buying strength, lower support areas could come under additional testing in the near term.


 Bengali (Bangladesh) ·
  English (United States) ·