
 1 hour ago
4
1 hour ago
4 

Dogwifhat (WIF) shows a bullish long-term setup as analyst Hailey LUNC projects a major Elliott Wave rally. With $0.64 support as the key invalidation point, Dogwifhat eyes a potential breakout toward $5.5–$6.8 and possibly $12–$18.
Elliott Wave Projection Outlines Bullish Path
Analyst Hailey LUNC shared a detailed Elliott Wave projection, indicating a potential long-term upward structure. Her chart shows the asset currently moving within the second corrective wave, labeled “II” or “2,” with key support at $0.64. This level also serves as the invalidation point for the pattern, making its defense essential for the bullish count to remain valid.
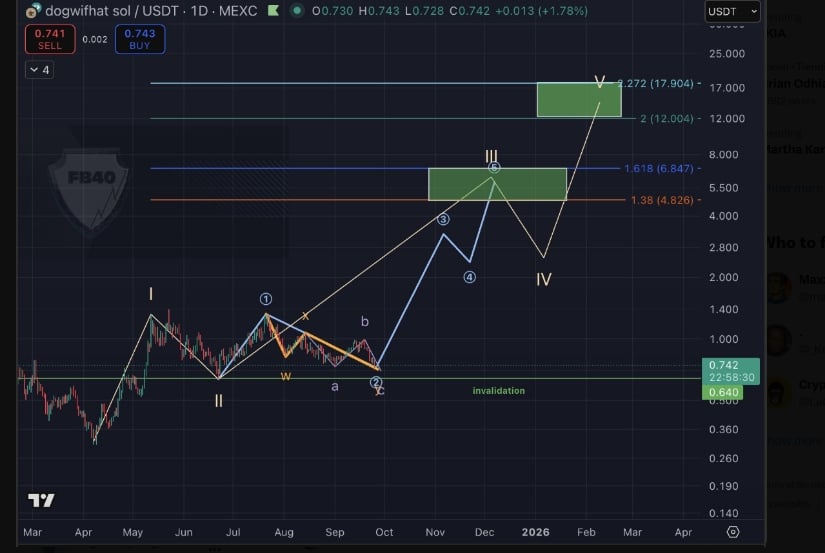
WIFUSDT Chart | Source:x
Once the second corrective wave completes, the projection suggests that the asset could enter a strong third wave. Elliott Wave theory often associates this phase with powerful rallies. According to Hailey, the third wave may extend toward the $5.5 to $6.8 range, supported by Fibonacci extension levels of 1.38 and 1.618. The setup anticipates a fourth-wave pullback in early 2026, followed by a fifth wave that could target $12 to $18, aligning with 2.0 and 3.272 Fibonacci extensions.
Key Support and Resistance Levels in Focus
Market participants are closely observing the $0.64 level, which acts as the critical invalidation point for the bullish scenario. Sustained defense of this zone could trigger the anticipated third wave advance. On the upside, resistance is forming around the $4.8 to $6.8 region, which will be watched as a breakout area to confirm the larger upward structure.
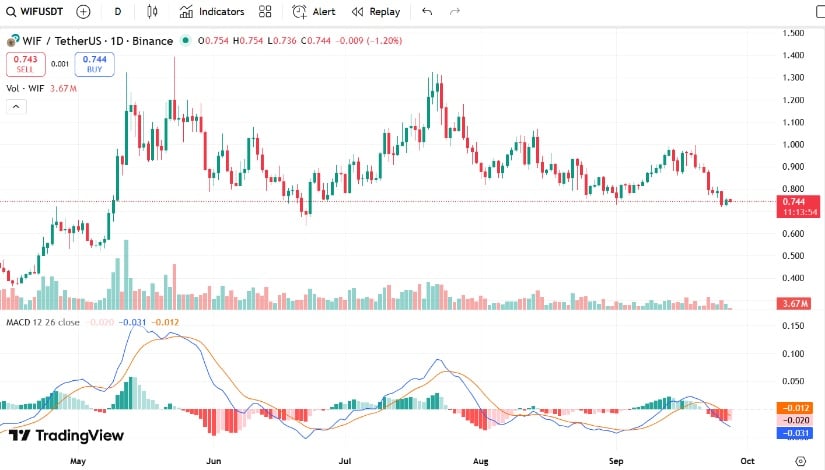
The WIF/USDT daily chart shows the token trading at $0.742, down 1.46% in the latest session. Price action remains inside a broad range established since May. Repeated attempts to break above $1.20 have failed, while dips toward $0.60 have consistently drawn buyers. Over the past two weeks, the altcoin has retreated from above $1.00 to test horizontal support between $0.70 and $0.75. This range has historically sparked rebounds, reinforcing its relevance for traders monitoring short-term moves.
Market Activity and Short-Term Trend
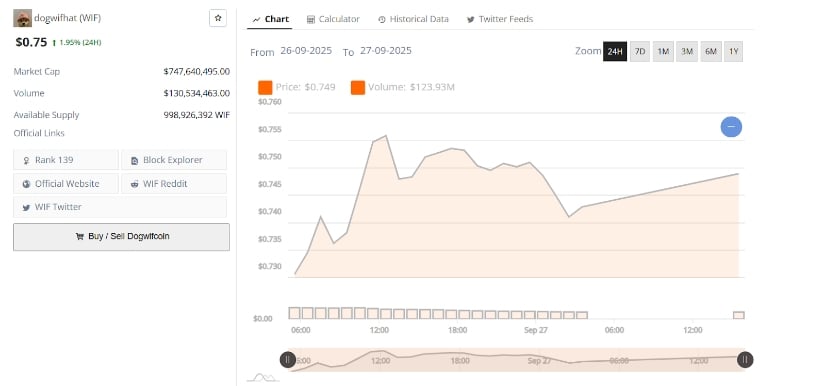
The 24-hour chart reflects Dogwifhat trading in a narrow, upward-tilting range. The token opened the period near $0.73 and quickly advanced above $0.74, hitting an intraday high of about $0.755 before midday. Afterward, mild selling pressure brought prices back toward $0.74–$0.745, where they stabilized without deeper declines. This pattern suggests that buyers are defending key short-term support levels.
WIFUSD Chart | Source: BraveNewCoin
Trading volume mirrored the price movement. It climbed sharply during the morning rally, surpassing $123 million, then eased as the market consolidated. The volume slowdown into the U.S. session suggests a pause in momentum rather than a reversal. As of now, Dogwifhat’s market capitalization stands near $747 million, with 998.9 million tokens in circulation.
Technical Indicators Signal Caution
Momentum indicators present a cautious picture. The Moving Average Convergence Divergence (MACD) line is at -0.032, below the signal line at -0.012, and both remain under the zero line. This setup shows weak momentum and supports the current downtrend. A bullish crossover and a return above zero would be needed to signal renewed upward pressure.
WIFUSD Chart | Source: Tradingview
If bullish sentiment strengthens and volume increases, the token could retest resistance at $0.755 and possibly approach $0.80. A sustained break above $0.80 would open a path toward the $0.95–$1.00 region. Conversely, failure to hold the $0.70–$0.75 support may lead to further declines toward $0.60, a key base from earlier in the summer.


 Bengali (Bangladesh) ·
  English (United States) ·