
If you're checking crypto prices today, brace yourself: it's a sea of red. Bitcoin ($BTC) has slipped back below the $60,000 mark once again, dragging nearly the entire market down with it. After a brutal inflation-driven sell-off, the world's largest cryptocurrency is now trading around $59,586 — and almost every major coin is bleeding alongside it.
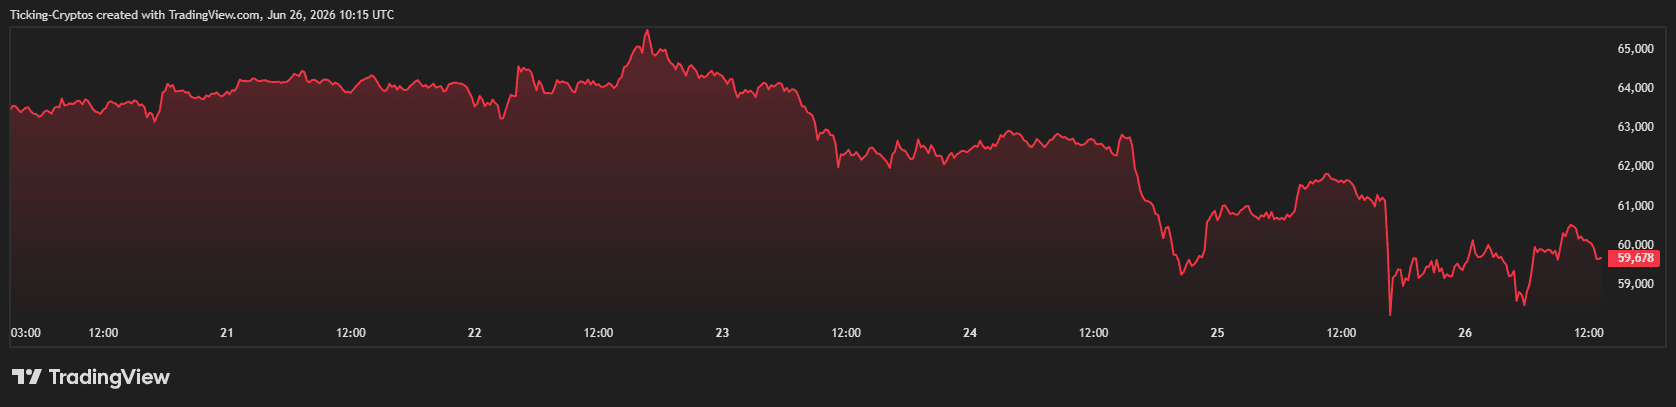 Bitcoin Price in USD
Let's break down exactly where crypto prices stand today, which coins are getting hit hardest, and what's behind this latest leg lower.
What are the crypto prices today?
The damage is broad and deep. Here's where the top of the market sits right now:
Bitcoin ($BTC): ~$59,586 — down 3.39% on the day, down 4.35% over 7 days, and a painful 31.91% in the red year-to-date. Market cap still commands a massive $1.19T.Ethereum ($ETH): ~$1,550 — the worst major performer, down 5.80% on the day and a brutal 47.73% YTD.XRP ($XRP): ~$1.03 — down 4.49% on the day and down 8.34% over the week, clinging to the $1 line with a 43.96% YTD loss.BNB ($BNB): ~$565 — holding up best among the large caps, down just 0.53% on the day.Solana ($SOL): ~$69 — down 0.94% on the hour but actually up 1.07% over 7 days, a rare pocket of relative strength.Dogecoin ($DOGE): ~$0.074 — among the heaviest weekly losers, down 9.77% over 7 days.Two names buck the trend worth noting. TRON ($TRX) is roughly flat and remains one of the only majors in the green year-to-date, up 13.25%. And Hyperliquid ($HYPE), despite a 5.46% weekly dip, is the standout of the entire board with a staggering 148.16% YTD gain — a reminder that even in a bloodbath, isolated strength exists.
Why is Bitcoin below $60,000 again?
The trigger this time was macro, not crypto-specific. The catalyst was the US Personal Consumption Expenditures (PCE) report, which showed inflation running hotter than economists had forecast — and because PCE is the Federal Reserve's preferred inflation measure, an upside surprise immediately raises the probability that the Fed keeps interest rates elevated for longer.
The numbers were ugly. Headline PCE inflation rose to 4.1% year-over-year in May, the highest reading since 2023 and more than double the Fed's 2% target. Higher-for-longer rates are kryptonite for risk assets — when government bonds yield 4.5–5%, capital rotates out of speculative plays like crypto and into safe yield.
The market repriced instantly. The inflation shock triggered $1.48 billion in crypto-wide liquidations within 24 hours, with long positions bearing the brunt at $1.21 billion of that total and Bitcoin alone seeing $665 million in forced exits. At its worst, the drop was severe — Bitcoin printed a 21-month low of $58,115 during the session before staging a partial recovery.
What else is dragging crypto prices down?
The inflation print was the spark, but several forces are amplifying the damage at once.
First, the Fed outlook has structurally shifted. Markets repriced the probability of a December rate hike to roughly 77%, with Bank of America now expecting three rate increases in 2026 and Deutsche Bank forecasting two hikes starting in September. The market has gone from pricing cuts to pricing hikes — a brutal reversal for crypto.
Second, the AI trade keeps stealing crypto's capital. AI infrastructure stocks continue pulling speculative capital away from crypto, and the Nasdaq 100 erased an intraday rally on the same inflation news, with the two markets tracking each other closely all year.
Third, there's a massive options expiry landing today. The largest quarterly options settlement of 2026 is clearing on Deribit, with $10.6 billion in open interest, 80% of positions out of the money, and max pain sitting at $72,000 — roughly $12,000 above the current spot price. The market was positioned for higher prices that simply never arrived.
On top of all that, the fear is palpable. The Fear and Greed Index is sitting deep in Extreme Fear, around 20–23.
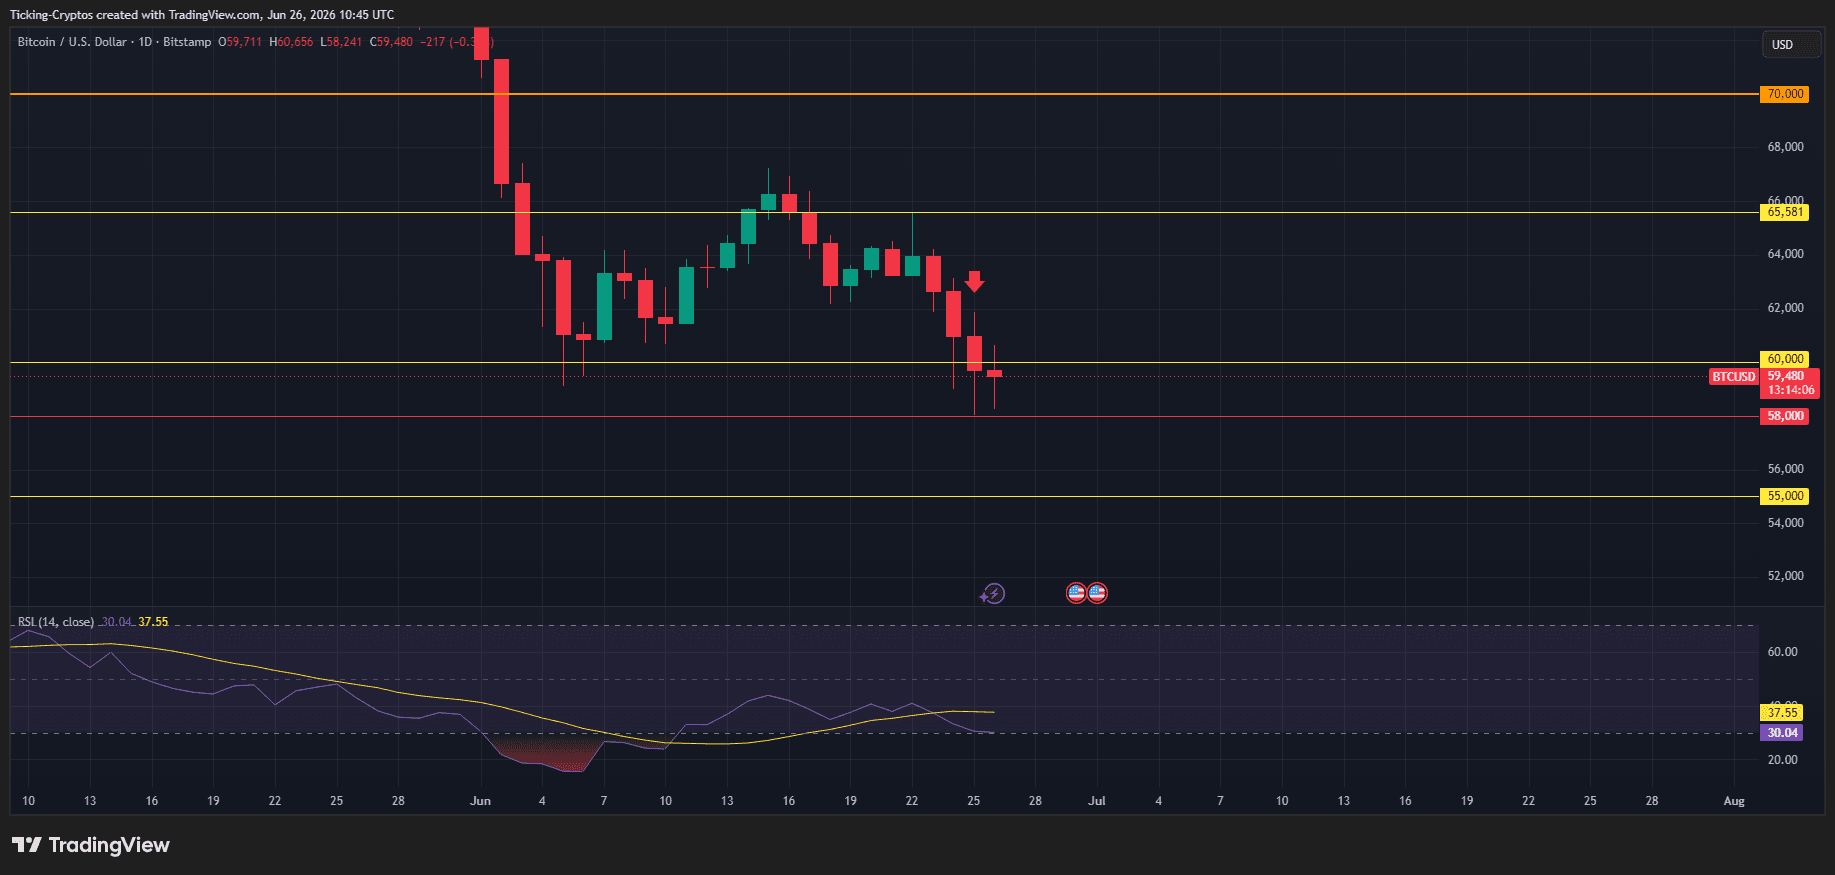
What are the key levels to watch?
With $60,000 broken again, the technical map matters more than ever. The $59,000 level is the market's load-bearing floor today, and a close below it shifts the next reference point to $55,000, with deeper bearish targets at $52,000 and below still on the table.
On the way back up, the bulls have work to do. The first resistance cluster sits at $61,800–$62,000, while the $63,000–$64,400 zone — where the 21-day EMA sits — would need sustained buying to break.


 Bengali (Bangladesh) ·
  English (United States) ·